

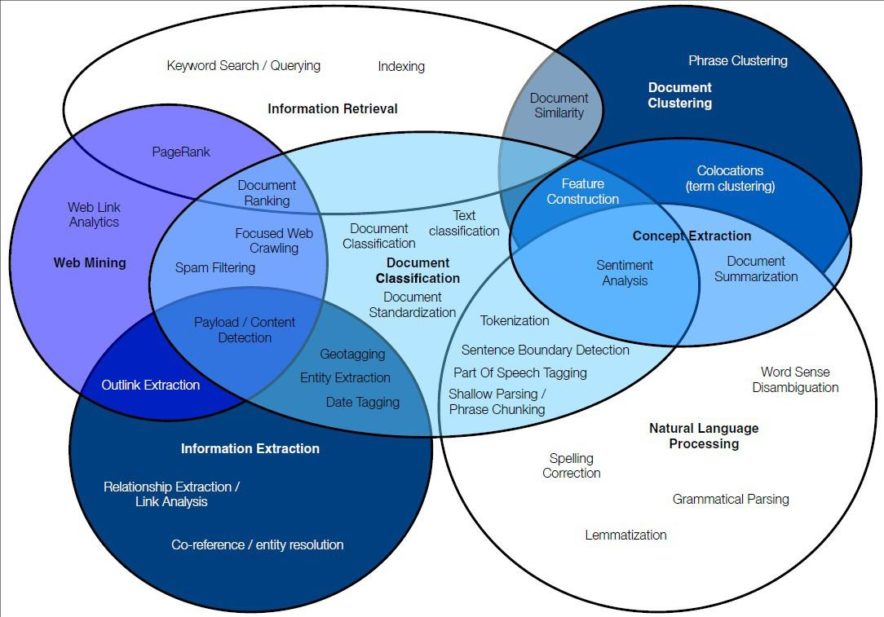
The growth of the Internet has led to an exponential increase in the number of digital text being generated. Analysis of the textual information has become a notable field of study.
Texts are part of quotidian life. Textual data are used in personal as well as professional life as a reliable and effective way of communication. In this article, we will focus on the text clustering of similar sentences using word embeddings.
What Is the Idea Behind Clustering?
Generally, clustering algorithms are divided into two broad categories — hard and soft clustering methods. Hard clustering algorithms differentiate between data points by specifying whether a point belongs to a cluster or not, i.e absolute assignment whereas in soft clustering each data point has a varying degree of membership in each cluster.
Dimensionality reduction methods can be considered as a subtype of soft clustering; for documents, these include latent semantic indexing (truncated singular value decomposition on term histograms) and topic models. Other algorithms involve graph-based clustering, ontology supported clustering and order sensitive clustering. Given a clustering technique, it can be beneficial to automate the process of deriving human-readable labels.
The two principle algorithms that are used in this section for clustering are k-means clustering and hierarchical clustering. Hierarchical clustering is used for obtaining an in-depth analysis of the cluster as well as determining the basis of clustering for each data point, while k-means are used for an efficient and fast information retrieval clustering system.
Here, we will consider a custom example in which there will be certain sentences stored in the form of a list. We will try to apply text mining and machine learning algorithms to try to cluster similar sentences together. In this example, we will use Word2Vec model.
Why Use Word2vec Model?
The Word2Vec model is a state of the art method which was invented by Tomas Mikolov.
This model is based on neural networks and is used for preprocessing of text. The input for this model is usually a text corpus. This model takes the input text corpus and converts it into numerical data which can be fed in the network to create word embeddings. For working with Word2Vec, the Word2Vec class is given by Gensim.
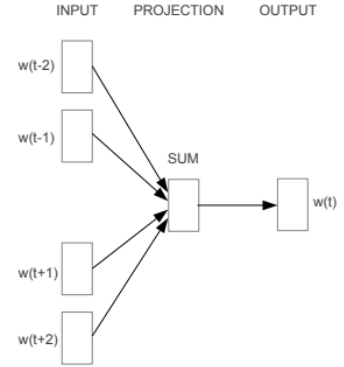
The Word2Vec model has two main models, namely, skip-gram and CBOW models. The CBOW model stands for Continuous Bag of Words model which takes the context of the textual data in consideration. It then aims at predicting the words related to the context. Let us take an example of a sentence, “ the brown lion jumped over a deer”. In this sentence for analyzing the context, first, we have to choose a window frame. In this example, we will take the window size of 2.
Now, we have the following pairs: ([lion, jumped]),([over,deer]). Hence the CBOW model will try to predict words based on the context.
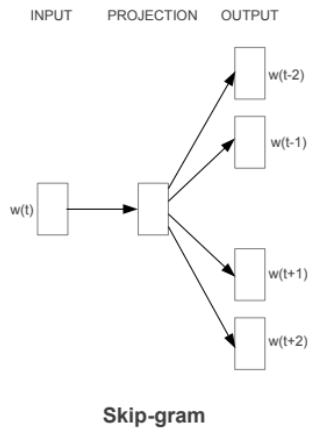
The skip-gram model is a simple and basic model. It works with great efficiency when the dataset is small. We will take the same example as used above. It basically does the reverse of the CBOW model. It tries to predict the context from the words. Hence it will try to predict [lion, jumped] with the given target word ‘brown’.
Code Implementation
We will now use our own example to demonstrate similar sentences by the means of clustering. We will use Jupyter Notebook for writing and implementing a python code.
1. Importing Libraries
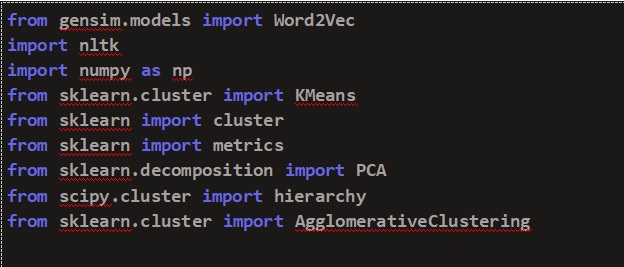
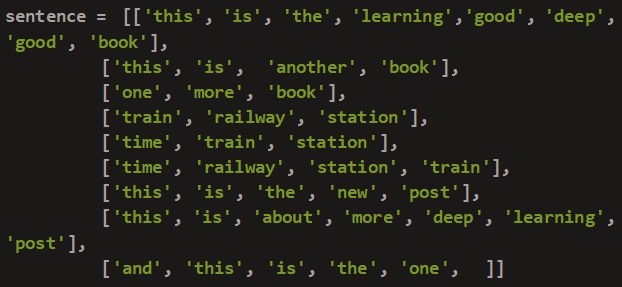
2. Creating our own dataset
We will take different types of sentences based on different topics.
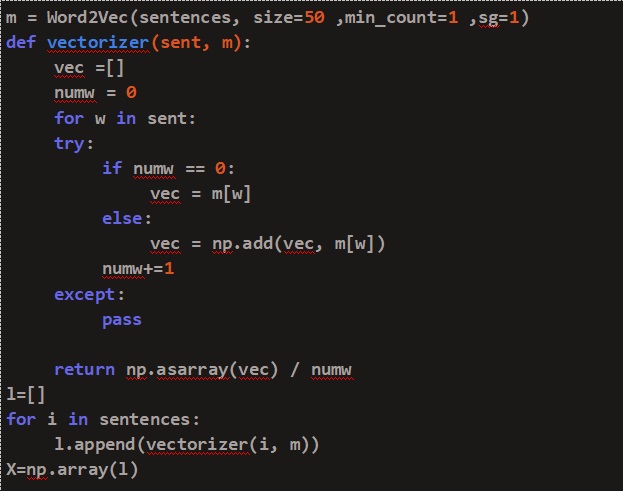
3. Creating the Word2Vec model
We have created a model using Word2Vec which has min_count=1, min_count=1 is the window size for the seeking the words.
A function, vectorizer, is created which will help in addition to each word’s vector in a sentence and then dividing by the total number of words in that particular sentence.
4. Clustering
4.1 K-means clustering
The k-means clustering algorithm is an unsupervised clustering algorithm which determines the optimal number of clusters using the elbow method. It works iteratively by selecting a random coordinate of the cluster center and assign the data points to a cluster. It then calculates the Euclidean distance of each data point from its centroid and based on this, it updates the datapoint positions as well as the cluster centers.
For minimizing the Within cluster sum of squares(WCSS) the following formula is used :
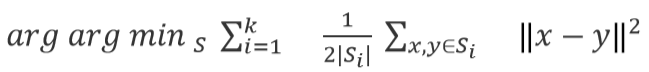
Where the mean points and x contains observations in a d-dimensional vector and k is the number of cluster centers.
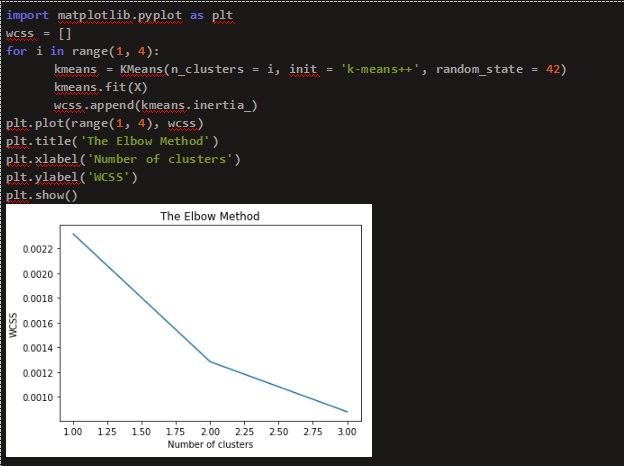
For finding the optimum number of centroids, the ‘elbow method’ is used. In it, the SSE value(sum of squared error) is calculated for different values of k (i.e no. of clusters) by clustering the dataset following each value of k. The point on the graph where a ‘hinge’ occurs is considered to be the optimal value of k. Figure 3. shows the elbow method for k means algorithm. Thus, by looking at the graph, the total number of clusters is found to be 2.
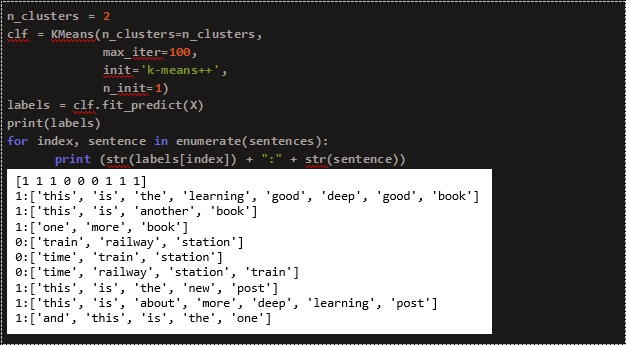
Using the cluster numbers obtained from the elbow method, we use the k-means algorithm to predict the labels. Here o and 1 corresponds to different clusters.
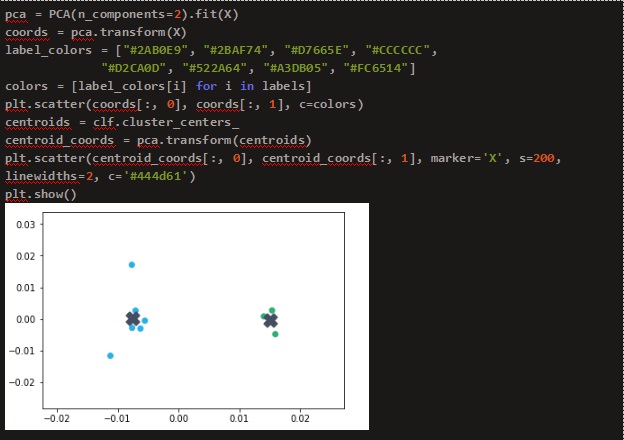
The clusters are plotted using the Principle Component Analysis (PCA) with ‘X’ indicating the cluster centers.
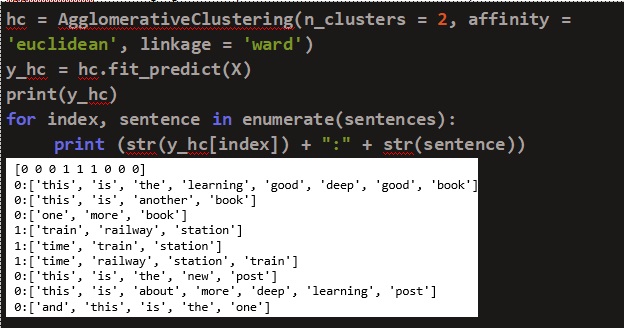
4.2 Hierarchical clustering
Hierarchical clustering creates clusters which consist of a predetermined ordering from top to bottom. In this paper, Agglomerative method is used for hierarchical clustering. It is a bottom-up approach where each observation is assigned to its own cluster and each data point is considered as a separate cluster. The distance between each cluster is calculated using Ward’s method and two similar clusters are combined together. This process is continued until there is only one cluster left. The Ward’s method for calculating distance is given by the following formula:
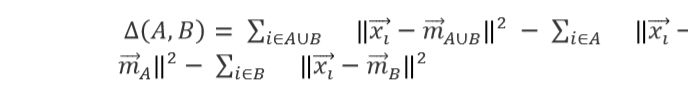
Here, mj is the cluster center of j and nj is the number of points inside the cluster. refers to the cost of the combination of A and B. Basically, the sum of squares is zero in the beginning and grows gradually as the clusters are merged. This method is responsible for keeping this growth as minimal as possible.
A dendrogram is plotted by using the hierarchy dendrogram function from the scipy module. The Dendrogram is shown below in Figure.
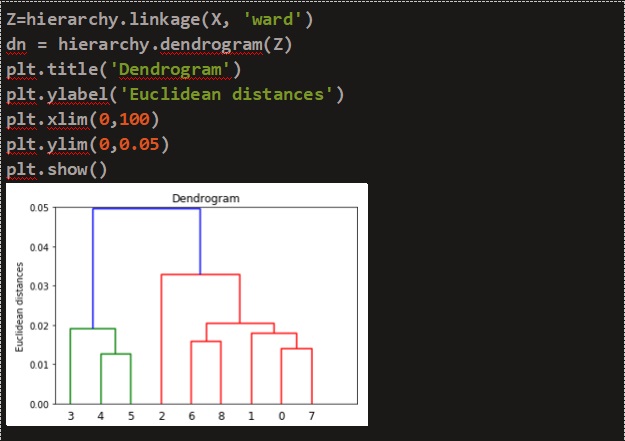
By analyzing the dendrogram, the number of cluster centers was chosen as two. We used an agglomerative clustering algorithm to predict the labels. Here o and 1 corresponds to different clusters.
Hence we studied a similar sentence clustering by applying two state-of-the-art clustering algorithms namely, k-means and hierarchical clustering algorithm. Hope you found it helpful. Stay tuned for more amazing articles!

