

What is data visualization?
It’s better to visualize the data rather texting it. The brain anatomy also says that, our brain process images up to 60 times faster than written data. So visualizing is much better than writing the facts and that gave rise to big data visualization. Depicting the facts and analysis report is much better than documenting it. In other words data visualization is a visual representation of results obtained from various analyses.
The data visualization tools are so easy to implement and are dynamic in nature that on changing of data it quickly changes its fact and graphic representation, so it simply means that data visualization tools has a property of real time support. The main goal is to be able to communicate the information clearly and efficiently.
Why data visualization is necessary for big data analytics
- Business intelligence dominates the industry trends
Recent trends in Business intelligence influence many areas such as big data analytics, social collaboration, social networking and some other useful areas of cloud computing. Data visualization affects these trends, being a consumer or creator and these tools also helps the market competitors to stay ahead in BI industries.
- Data visualization helps in identifying the Target audience
It is very much important to know the target audience to quickly establish the story board, making to understand the approach and efficiently gathering the user’s data and visual requirements. Depending upon the audience that comprises of managers, domain experts or some higher level vice president of an organization our resulting data visualization must be very high and accurate for gaining an insight and giving a 360 degree view, allowing the audience to drill down for some key details.
Benefits of data visualization
Data visualization tells very clearly the whole story line of how the things are going to proceed. This technology gives a clear narrative that must include complete plot. After successful data visualization session a person should be clearly able to identify key measurements that can be easily viewed, managed and monitored as well. Many of the tools focus on the data that is actually needed to be addressed for a specific domain.
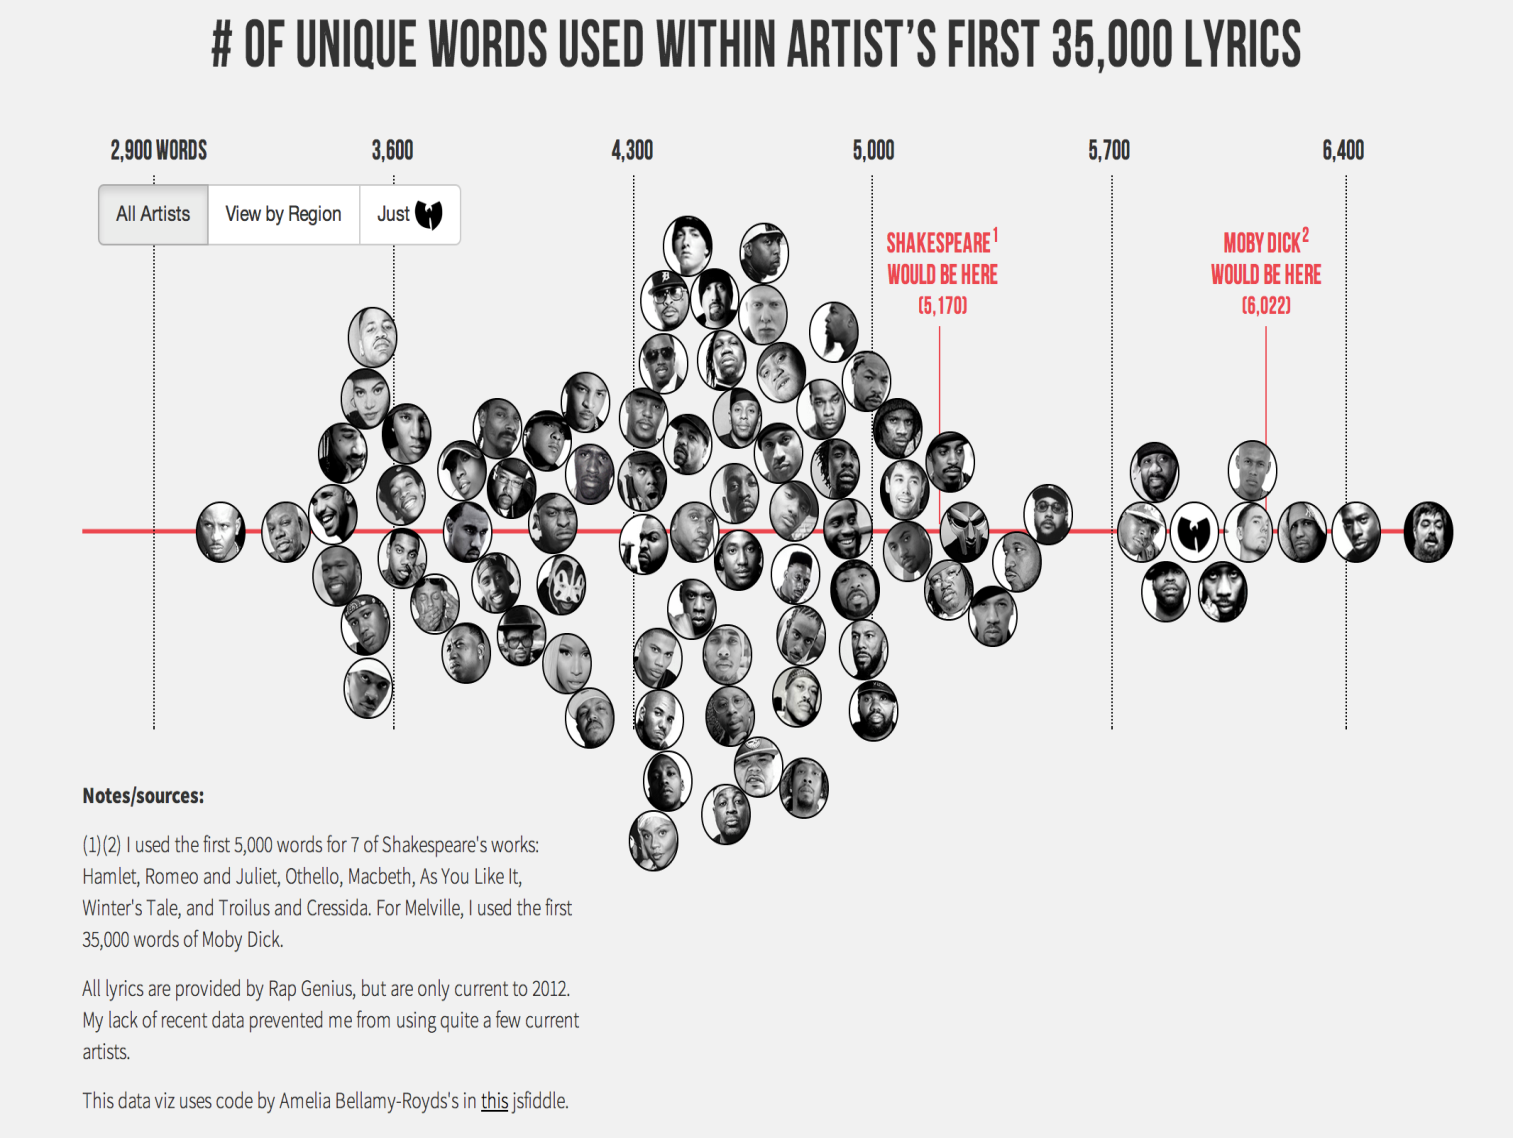
A real world problem solving example of data visualization, where counting some unique words within the artist, taking a sample data of 35,000 lyrics. This helps in solving a real time use cases within the music industry.

Tools for data visualization
Many tools used for data visualization are open source and there are many of the free applications that can be used for data visualization and also used with some programming technologies such as JSON (Java Script object Notation), HTML 5 or dominating languages like python. Some of the tools used are-:
- PolyMaps
It is best suited for showing data of country, state or street views. It uses vector graphics and supports Java script for image and vector tiled maps. It is also helpful in displaying complex datasets over Maps.
- Datameer
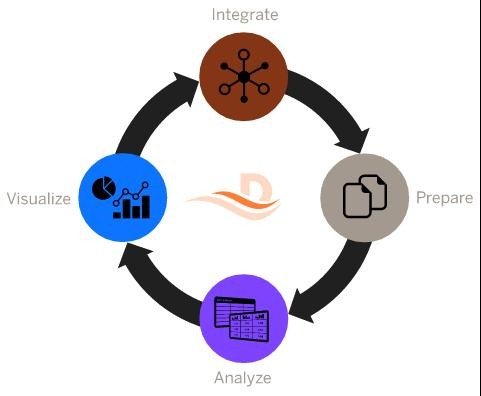
Data visualization tool designed for dynamic data visualization that can integrate, prepare and analyze any kind of data, highly suitable for end to end data visualization that can be used with hadoop that makes the data simple for their audience. It has a compatibility feature with hadoop that combines self-service data integration technology.
Implementing DataMeer for apache hadoop
Here are some steps for easy installation of Datameer for data visualization-:
Step 1: Downloading the latest release of Datameer from my.datameer.com, unzipping the installed file, and then changing the working directory.
Step2: Adding a new user and adding a new group (using traditional linux commands), changing the owner and user of the group.
Step3: Configuring the Datameeer by editing the /etc/das-env.sh allocating additional memory to and changing from 1 GB to 2 GB.
Step4: Changing the stored data directory and making a backup of das-data.
Step5: Setting up MySQL Database
Datameer provides a tool to migrate data from HSQL file to MySQL database file. Using following command
bin/migrate-db-tool.sh hsql-file:<Datameer user path>/Datameer/<version>/das-data/database mysql
Step6: Configuring DataMeer for MySQL
- Changing the DAS_DEPLOY_MODE to live DAS_DEPLOY_MODE=live
- Changing MySQL database credentials in the database script using following command
vi bin/mysql-init.sql
- Changing the MySQL database credentials in default properties file (using VI editor)
VI conf/default.properties
Changing the following properties
system.property.db.name=dap
system.property.db.username=dap
system.property.db.password=dap
system.property.db.host=localhost
system.property.db.port=3306
Step7: Installing DataBase Drivers (JDBC connector), downloading the file, unzipping it and copying the MySQL connector to the directory
/etc/custom.jars
Step8: Installing the license file and copying the license file to $INSTALL_LOCATION/das/ <version>/etc/license
Step9: Start, Stop and restart the application using following commands
Bin/conductor.sh start
Bin/conductor.sh stop
Bin/conductor.sh restart
Step9: Testing Datameer against some pre compiled examples using the following command
Bin/conductor.sh start --injectExamples
Optional Steps
In order to install our own custom database, so that we can connect with other type of databases for our existing database for Apache hadoop, each of the database installation has its own installation instructions.
Some of the distributions are-:
- Cloudera
- IBM PFS (Parallel file system)
- MAPr
We can install various versions of this distribution for running Datameer and making the things enable in order to have a correct data visualization tool. With the help of Datameer visualization tool we can easily manage our data in graphical form and will be able to perform fast and reliable Business intelligence logics.
After installation of Datameer, we will be provided with a dashboard that we will be using with hadoop, furthermore there are many techniques that channel the specific data to Datameer for visualization.
We can use Datameer for PIG and Sqoop for Batch and real time processing as well
Conclusion
This article describes the data visualization technologies and makes the users to enable the use of this powerful tool so that they can be able to visualize the massive raw and unstructured data. We have also discussed about one of the prominent data visualization tool for implementing in hadoop that gives an insight to make data visualization a better technology for big data analysis.

