

Visual data mining striking in collaboration with big data
The new era enables something new within it, it’s the data era and it’s all about data and data. Many companies were using data mining as a prime source of gaining expertise knowledge as data mining was the first and foremost preferred technology for many of the IT experts and researchers. However, on arrival of Big Data and Hadoop framework, many of the technologies started collaborating with this open source framework. Hadoop is known for its ability to handle a variety of data in a pretty efficient manner. Despite some challenges faced by the open source framework, it started to incorporate other sources for better analysis of raw data and also moulded itself to become familiar with other technologies.
What is visual data mining?
Visual data mining is a term used to allow business users and researchers to mine and extract data. The data is used to gain useful information and is represented in some visual form (the visual formation of data depends on the parameter set and the purpose for mining the data). Visual data exploration gives users better results using a advance algorithms for knowledge extraction from complex data sets.
Predictive analysis is helpful for visual data mining
Predictive analysis is the use of algorithms and machine learning techniques to analyze historical data to give a clear picture of the trend that currently exists. It determines possible future outcomes based on the data that is already present, allowing the user to make a clear decision based on past statistics.
Implementing predictive analysis for visual data mining and data analytics
This is a real time example of running software for predictive analytics for visual data mining and machine learning. It lets you load data from any source (the sources that includes transferring any type of variety of data from an SQL database). With the help of predictive analytics software, we can get a clearer picture of the data that is scattered across the vast internet, enabling us to make better decisions. Moreover, it can be used for applying predictive models for publishing results.
Useful algorithms that help in predictive analysis for visual data mining
- One of the renowned algorithm that is known as Desktop R algorithm is helpful for visual data mining, allowing us to easily modify scripts that are written in R programming language (R programming is helpful in writing scripts for analysis and knowledge extraction).
- Native algorithms for in memory cluster computing and (used with apache spark for real time in memory analytics) where the logics are implemented natively (embedding the algorithm logic within the code without using API) usually known as predictive analytics core.
- SAP’s version of in memory cluster computing known as sap HANA that is an in memory column oriented cluster computing relational database running on the top of predictive analysis library functions, they run in database in software itself (HANA).
Features used within visual data mining in hadoop
Some of the useful features used while analyzing big data is to automate the data and prepare it for better results, it also enables a developer to deploy map reduce job with ease and models the data flow in minutes. Some of the hidden insights that scales for terabytes and petabytes are rapidly increasing from 1000 to 10000 variables with no expert intervention. With the help of predictive and visual data mining one can even embed predictive results to integrate and connect with various other apps (platform independent applications depending upon Application programming interface used). This will also be helpful for business intelligence environments for greater consumption and better output.
Big data predictive analysis with visual data mining
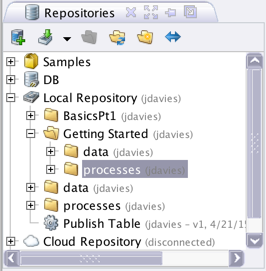
Step 1: Importing the data: before analysis it is always important to analyze the size and type of the data and this step enable us to import the data before analyzing it. Rapid miner is the tool that is used for predictive analysis. Locate the repository (a place where the data is stored, processed, and analyzed).
Step 2: Creating a new repository, creating a new folder and importing the data.
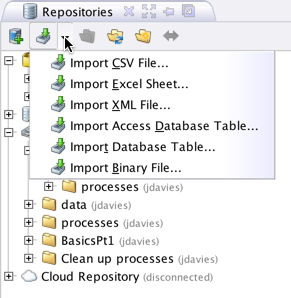
Step 3: Importing the data (it can be imported using csv file, excel sheet, xml file, and Microsoft access database or any binary file).
Step 4: Browse the folder where the data is imported before getting started and once the data is stored in the repository, it automatically converts the data into rapid miner’s special data format.
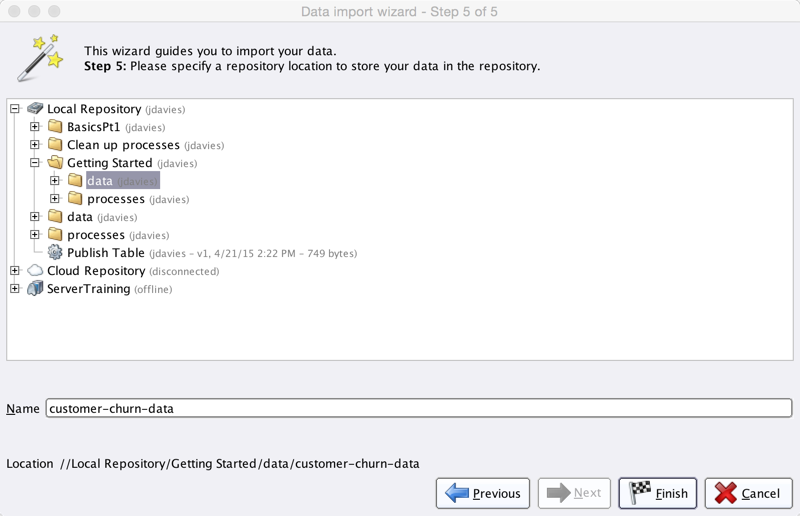
Step 5: On clicking finish, the data is stored in the repository and it can be used for visual analysis.
Step 6: Visual data mining: the interface has various tabs that includes a results tab for final output.
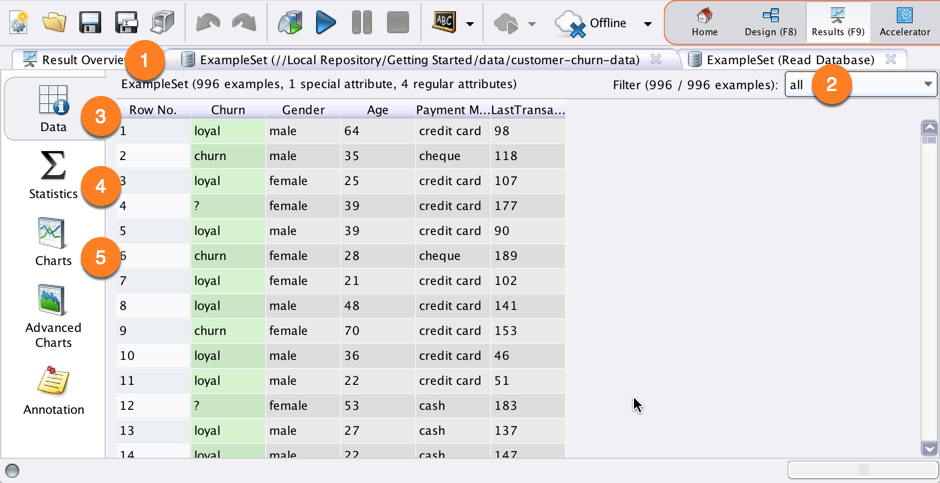
Data filter tab is used for filtration of data, whereas data view tab gives a data view for a particular instance of time and statics view will give an overall prediction of data for business intelligence.
Step 7: Statistics view will summarize and give a visual representation of the data that needs to be analyzed (the data that was imported).

Evaluation of the results
Evaluation is the final observation of the results where it is the necessity of the framework to test how accurately a model behaves when the data is dumped into it for analysis. It takes few steps to evaluate the data.
Imparting the data into equal parts and the parts should be non-overlapping after imparting the data. Test a model for first nine sets and then testing the model on remaining single part and recording the performance, iterating through these steps will yield an average value within each iteration and overall average value for each segment, in this way we can evaluate model for visual data management.
Conclusion
Predictive analysis is the future of the data analysis and we need some type of method to have a manageable system, that can have features and the power of analyzing structured as well unstructured data . For better understanding, this article describes some of the tools and techniques to visualize the unstructured data i.e. visual data mining and that will be a better choice for many BI (business intelligence) analysts.

