

R is actually a programming environment and language made specifically for graphical applications and statistical computations. It is licensed under the GNU license, just like the S language, which is developed by Bell Laboratories. It is very similar to the S language, though implemented in a different manner. Because of this, some programs written in the S language can also be run in R’s environment, without much alteration.
The R language is very useful in the field of statistical computation and data science. It offers various techniques like clustering, time-series analysis and classification technique, nonlinear/linear modelling and classical statistical tests. Also, this language is very adaptable and extensible. Along with these, it supports many graphical techniques too.
Some background of R:
R is a language and software environment which was made by Robert Gentleman and Ross Ihaka from the University of Auckland in New Zealand. It is used in various fields such as for analysis of statistical information, their graphical representation and their reporting. It is being further developed by the R Development Core Team. R is free under the GNU General Public License and its precompiled binary code is available for download. It also supports many operating systems like Windows, Linux and MacOS.
The name of this programming language originates from the initials of the first name of both its creators, which is R. Also, its name can be considered as a play on the name of the S language, which was created by the Bell Laboratories.
R was made in the 1990s when programming languages like Redmonk, Tlobe and PyPL were popular. It is an alternate implementation of the S language, as already stated. R is an important tool for machine learning and statistics, along with numerical analysis.
R features for data science applications:
R is a very unique language and has some really interesting features which aren’t present in other languages. These features are very important for data science applications. Some of these features are explained below:
- Multiple calculations can be done with vectors
R is a vector language. Unlike other languages, R can do many things at once. You can add functions to a single vector without putting it in a loop. This feature of R makes it more powerful and faster than the other languages.
- You can run your code without any compiler
As R is an interpreted language, you can run your code without any compilers. In other programming languages like Java or C, a compiler is required to make out the instructions from your code before running it. However, R directly interprets the code into a full-fledged program. This makes development of the code easier.
- Statistical language
R was designed for statistical studies, and proved excellent in its field of work. However, as the power of R is being realised, it is finding use in a variety of other places, starting from financial studies to genetics and biology and medicine. This is because R is a Turing-complete language, which means that any task can be programmed in R.
- Data science support
R provides support functions for data science applications. Some of them are charts, graphs, data interface, statistical functions, etc. All these functions are specifically used for data science applications and statistical analysis.
Why R is important for data science professionals?
R is very important in data science because of its versatility in the field of statistics. R is usually used in the field of data science when the task requires special analysis of data for standalone or distributed computing.
R is also perfect for exploration. It can be used in any kind of analysis work, as it has many tools and is also very extensible. Additionally, it is a perfect fit for big data solutions.
Following are some of the highlights which show why R is important for data science:
- Data analysis software: R is s data analysis software. It is used by data scientists for statistical analysis, predictive modeling and visualization.
- Statistical analysis environment: R provides a complete environment for statistical analysis. It is easy to implement statistical methods in R. Most of the new research in statistical analysis and modeling is done using R. So, the new techniques are first available only in R.
- Open source: R is open source technology, so it is very easy to integrate with other applications.
- Community support: R has the community support of leading statisticians, data scientists from different parts of the world and is growing rapidly.
So, most of the development of R language is done by keeping data science and statistics in mind. As a result, R is become the default choice for data science applications and data science professionals.
How to download, install and setup R?
R can be downloaded from the following link.
Download link: https://cran.r-project.org/mirrors.html
For windows, you can run the (.exe) file and accept the default settings. After installation, open R-GUI/R console for running R programs.
For Linux, binaries are available for the different flavours. You can use yum command to install R.
R – Data science applications:
In this section, we will try to explore some data science applications by using the R language. It will focus more on the data and coding part. We will also use statistical functions and visualization methods of R to show the results clearly.
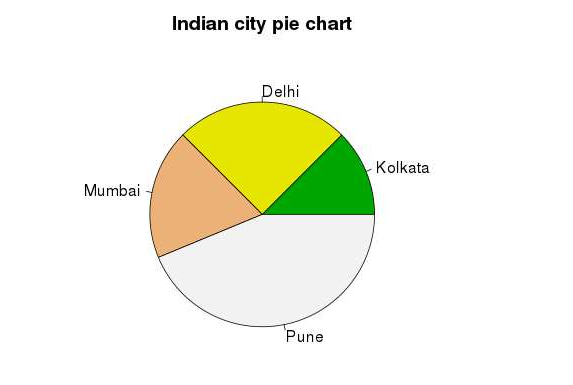
In the first example, we will explore the visualization part of R by using a pie chart. Let us consider some data of four cities as shown below. We also want to plot a pie chart based on these data. This data can be coming from any statistical analysis on these four cities. In this example, we are creating a set of data, assigning it to a variable and then plotting the pie chart.
Listing 1: Pie chart example
# Let us prepare the data for the pie chart.
x <- c(20, 40, 30, 70)
labels <- c("Kolkata", "Delhi", "Mumbai", "Pune")
# Provide the file name.
png(file = "indian_city_colors.jpg")
# Now plot the chart
pie(x, labels, main = "Indian city pie chart", col = terrain.colors(length(x)))
# Save the file.
dev.off()
Now, after execution of the code, the output will be displayed as:
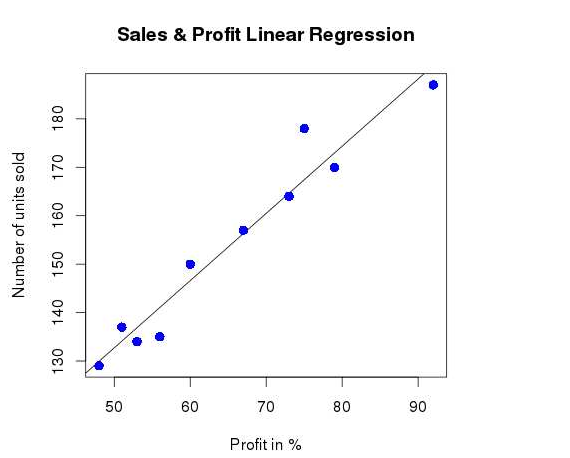
In the second example, we will talk about linear regression analysis which is widely used in data science applications. The two most important variables are ‘predictor’ and ‘response’. Value of a predictor is collected from experiments and this is the data to be used in analysis. The value of response is the output derived from the predictor data.
The general equation of linear regression is shown below
y=ax+b
y - response variable
x - predictor variable
a,b – coefficients
We will take an example of an e-commerce portal, where the profit percentage depends upon the units of sales per month.

Now, let us first prepare the sample data.
# Values of units of sales in an e-commerce portal
150, 170, 134, 187, 129, 135, 178, 164, 157, 137
# Values of profit in %.
60, 79, 53, 92, 48, 56, 75, 73, 67, 51
First, we will use the Im () function to create the relationship between predictor and response variable. After that we will use predict () function to check the result.
Listing 2: Predicting the value of profit % from sales figure
# Create the predictor vector.
x <- c(150, 170, 134, 187, 129, 135, 178, 164, 157, 137)
# Create the resposne vector.
y <- c(60, 79, 53, 92, 48, 56, 75, 73, 67, 51)
# Applying the lm() function.
relation_value <- lm(y~x)
# Find profit % when the sale unit is 155.
sale <- data.frame(x = 155)
profit <-  predict(relation_value,sale)
print(profit))
The output would be as shown below.
66.01306
Now, let us plot the chart for the above example.
Listing 3: Visualizing the profit %
# Create the predictor vector.
x <- c(150, 170, 134, 187, 129, 135, 178, 164, 157, 137)
# Create the response vector.
y <- c(60, 79, 53, 92, 48, 56, 75, 73, 67, 51)
# Applying the lm() function.
relation_value <- lm(y~x)
# Give file name.
png(file = "linearregression_profit.png")
# Plot the profit chart.
plot(y,x,col = "blue",main = "Sales & Profit Linear Regression",
abline(lm(x~y)),cex = 1.3,pch = 16,xlab = "Profit in %",ylab = "Number of units sold")
# Save output file.
dev.off()
Output of the above code would be displayed as shown below:
Limitations of R:
Everything has its pros and cons, and the cons of this language are speed and memory management issues. Though a lot of progress has been made in filling up these loopholes completely, they still pop up frequently.
A major limitation of this language is its lack of security measures. R cannot even be integrated with a web browser, thus it cannot be used for making web apps. Also, due to its lack of security, it cannot be used as a back-end server.
Along with this, there hasn’t been much interactivity in the language’s environment. So, other languages must come in to fill this loophole, for example JavaScript. The initial programming may be done in R, but the results must be shown in JavaScript for more interactivity.
R & Data science success stories:
Due to the many merits and features of R, it is being used in various high-profile areas. It is being used in Facebook for special tasks such as the behaviour analysis of the users.
It is also used for weather forecasting by National Weather Service. Google is also among thousands of its users, using it for various tasks like e-commerce. Orbitz uses this language for dynamic suggestion of hotels to its customers.
Conclusion:
R was extremely popular when it was first released back in the 1990s, and its popularity is growing with time as statistics is becoming more and more important every day. It has many features that make it really powerful. Also, it is a free open-source software which is being developed for ironing out the few creases it may have. Not only this, R is finding use in a variety of fields due to its features. In data science, however, it is the best language for use.

