
In this tutorial we are going to try drawing graphics in XML format. Certainly we are going to use XML format in SVG tags. After drawing graphics we will also try to animate some images.
Let’s proceed further step by step.
- Create a new folder on desktop with name “SVG”.
- Open a new notepad++ document and save it as “index.html” in the newly created folder “SVG” on desktop. While saving select its “Save as type:” as “Hyper Text Markup Language file(*.html,*.htm)”.
- Write the following html code in “index.html”.
- Here, the above code is simple html code. You can see a line
<meta charset=”UTF-8”/>
- This is a “meta” tag. meta tag provides metadata about the HTML document. Metadata is data about data. Metadata will not be displayed on the page, but it will be machine parsable. This tag is mostly used to specify page description, keywords, author of the document, last modified and other metadata. The attribute “charset” of meta tag specifies the character encoding for the HTML document.
- Next, body of the page is styled with a black background colour.
- The output of the code above is shown below:
- Now we will draw some figures like a square, circle, line and a polygon on the webpage in
<svg>--------</svg>
tags.
- Write the following code in the
<body>---------</body>
tag.
- In the above code, we have drawn various figures in XML format inside — tag.
- First a rectangle is drawn with id as redRect, width as 100 pixels with attribute width=”100”, height as 100 pixels with attribute height=”100”. Horizontal distance from left is given as 20 pixels with the attribute x=”20”. In the same way vertical distance from top is given as 10 pixels with the attribute y=”10”. This forms a square having red colour. The red colour is given with attribute fill=”red”.
- Second square is also created using the same parameters with id as redRect2, but it is placed below the first square.
- Third figure drawn is a circle with id as circle1 and radius as 50 pixels with attribute r=”50”. Horizontal distance from left is given as 70 pixels with the attribute cx=”70”. In the same way vertical distance from top i.e below the second square is given as 70 pixels with the attribute cy=”70”. This forms a circle having blue colour. The blue colour is given with attribute fill=”blue”.
- Now after circle fourth figure is a line with (x1,y1) and (x2,y2) co-ordinates as (0,0) (200,60). Since SVG uses geometric formulas to draw any figure, these are the two end points of the line to be drawn. These points are given by attributes x1=”0” y1=”0” x2=”200” and y2=”60”. Next styling is applied to the line. stroke:red; gives red colour to the line and stroke-width:2; brightens/darkens the line with red colour.
- Next a polygon with green colour is drawn. Points to draw a polygon are given by points=”20,10,300,20,170,50”. And green colour is given by fill=”green”. Any closed figure is given colour using “fill” attribute.
- Let’s see the output of the above code:
- You can see a height is given to each and every svg tag. This height is compulsory for svg tag, no matter whatever the height. We will see, what will happen if we avoid giving height to svg tag through an example.
- You just have to remove the height given to the first figure having id as redRect. Once you do this, the particular svg block of this square drawn will occupy the whole browser window, thus hiding all the other figures.
- The output of removing the height=”100” from
<svg height=”100”>
is shown below:
- Now write the following code in the
<svg>-----</svg>
tag, below the statement
<rect id=”redRect” x=”20” y=”10” height=”100” width=”100” fill=”red”/>
- We will make this square move horizontally towards right.
- The code is as follows:
- Here, animate tag is used to apply animation to the figure.
- Number of attributes are used in animate tag.
- The attribute attributeName=”x”, specifies the particular attribute of rect tag that is to be changed from time to time in animation. Here, we want the square to be moved horizontally towards the right side of the browser, so horizontal distance should increase. Therefore, attrbuteName is given “x” as its value, so that, the value of “x” increases from time to time.
- The attribute xlink:href=”#redRect” is given just for the sake of an id.
- Next begin=”0s” is the starting time of movement of the square. It is zero seconds, (s = seconds).
- The attribute dur=”5s” specifies the duration of the animation. Duration of movement of the square is five seconds.
- The attribute from=”30” and to=”500” indicates that the square should start moving from the position of 30 pixels to the position of 500 pixels.
- Here, there is another attribute, fill=”freeze”. This makes the square stop till it had reached. I mean, if the square has started moving from 30 pixels and its last position is 500 pixels, now when you apply fill=”freeze” to this square, it will move from 30 pixels till 500 pixels and then stop at 500 pixels position and stay there itself.
- The output of fill=”freeze” is shown below:
- But if you don’t apply fill=”freeze”, your square will move till 500 pixels and come back to its original position.
- There is another attribute that can be used instead of fill=”freeze”. This attribute is repeatCount, which allows the square to move to and fro continuously. This can be written as repeatCount=”indefinite”. You can give any number you want to repearCount attribute, the square will move that many times. Or else “indefinite” means repeating indefinite number of times.
- We finished animating the first square, now let’s do something different to the second square. Write the following code inside
<svg>------</svg>
for the second square, below the code
<rect id="redRect" x="20" y="10" width="100" height="100" fill="red"/>
- The code is given below:
- You can write all the attributes horizontally also, but it is a good practice to write it one below the other to avoid a crowd of keywords.
- The above code for second square is animated same as the first square, only difference is that its width is changed instead of horizontal distance and repeatCount=”indefinite” is used instead of fill=”freeze”.
- The output is shown below:
- Now, next figure is circle to which animation is to be applied. For this we need to write code inside
<svg>------</svg>
for the circle, below the code
<circle id="circle1" cx="70" cy="70" r="50" fill="blue"/>
- The code to be written is as follows:
- Here, in the above code we have applied the same animation as the first square to the circle. So the circle will move horizontally along the x-axis. For 5 seconds duration and then stop at 500 pixels.
- The output is shown below:
- Now how if the circle changes its colours automatically while moving? Isn’t it sound interesting. It is simple to do so.
- Write the following code below the animate tag, we wrote just now.
- For one figure you can have any number of animate tags.
- Here, the second animate tag is to change the colour of the circle, hence its name is given animateColor. No matter if you keep it animate only.
- Next attribute attributeName is given the value “fill”, because fill is the attribute that is responsible for giving colour to the figure.
- Next xlink:href=”#circle1″ gives id to the tag.
- The colours will change till 5 seconds.
- The attribute values is used to specify as to which colours should be given to the circle while moving. In the above code the circle is given blue, orange, yellow, green, red, indigo and violet colours.
- repeatCount=”indefinite” allows the colours to change indefinite number of times.
- The output is shown below:
<!DOCTYPE html>
<html>
<head>
<title>SVG</title>
<meta charset="UTF-8"/>
</head>
<body style="background:#000">
</body>
</html>
fig 1
<body style=”background:#000”>
<svg height="100">
  <rect id="redRect" x="20" y="10" width="100" height="100" fill="red"/>
</svg>
<svg height="100">
  <rect id="redRect2" x="20" y="10" width="100" height="100" fill="red"/>
</svg>
<svg height="130">
  <circle id="circle1" cx="70" cy="70" r="50" fill="blue"/>
</svg>
<svg height="100">
  <line x1="0" y1="0" x2="200" y2="60" style="stroke:red; stroke-width:2;"/>
</svg>
<svg height="100">
  <polygon points="20,10,300,20,170,50" fill="green"/>
</svg>
</body>
Explanation of the above code:
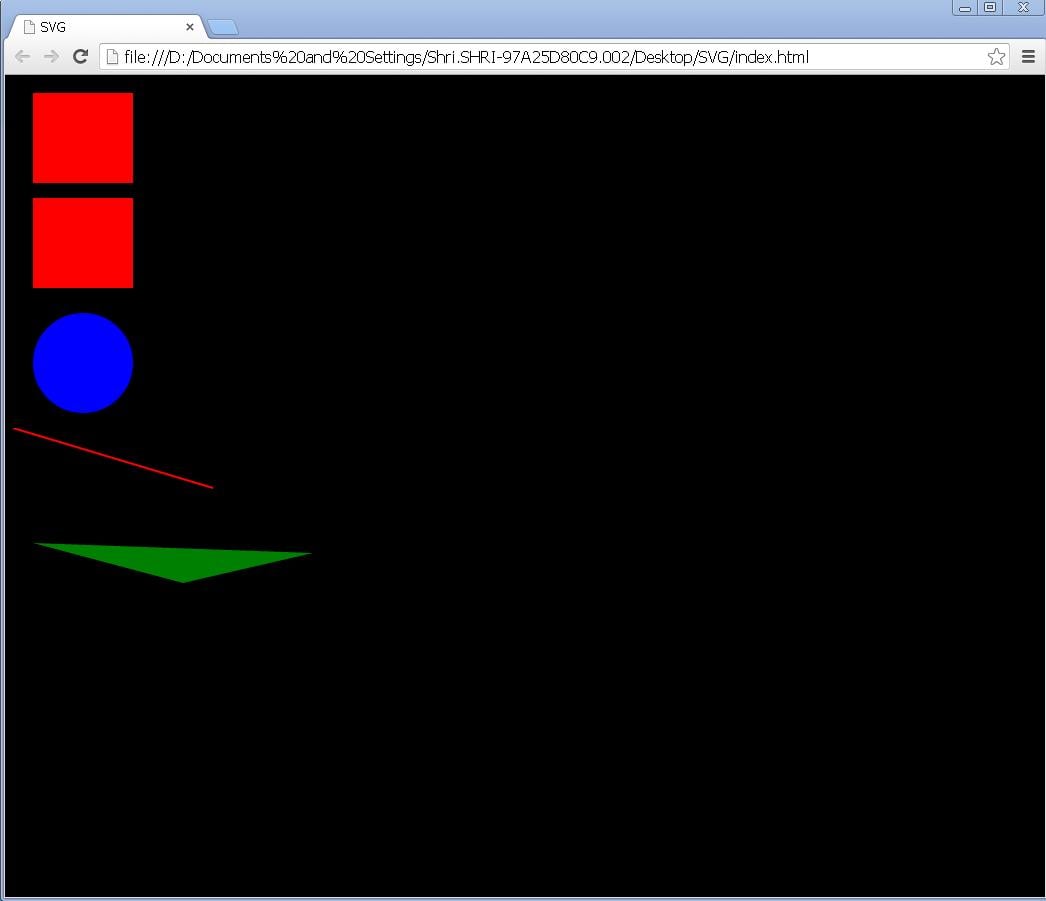
fig 2
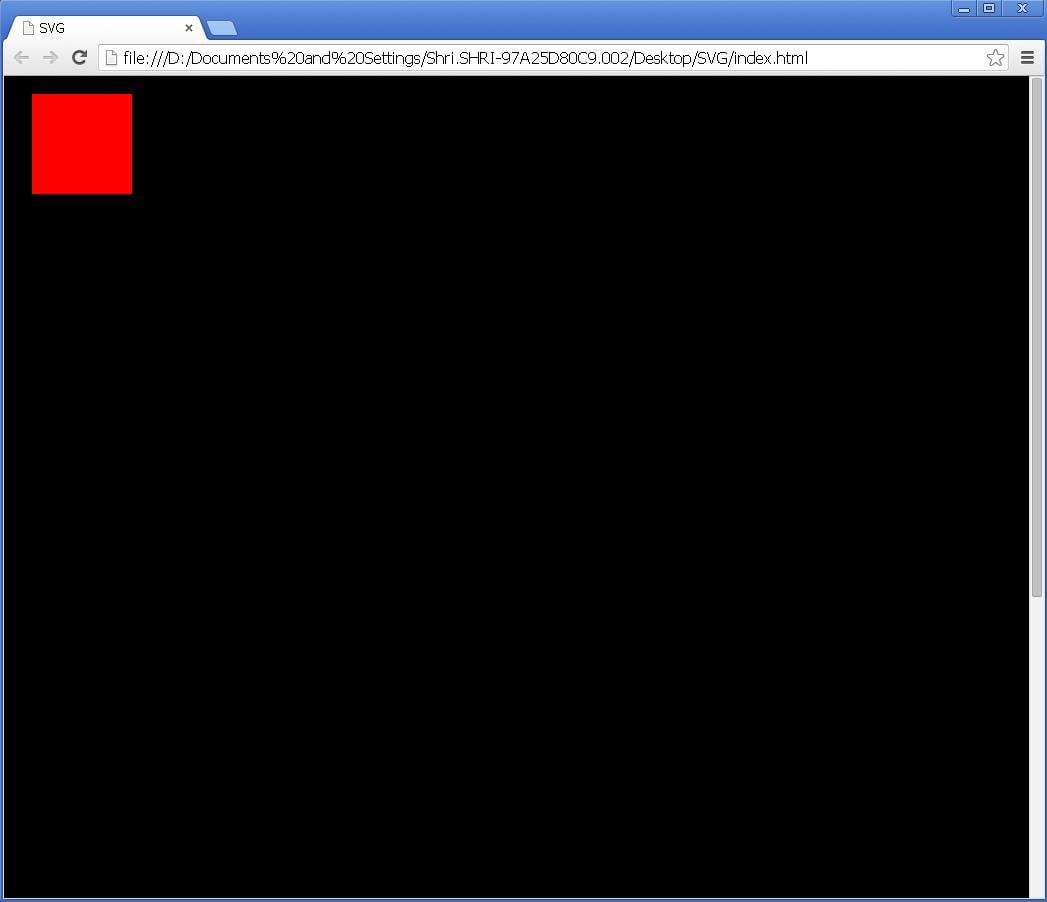
fig 3
We have finished drawing figures in SVG tags. Now let’s try something more. We will try to animate these existing figures.
So let’s continue.
<animate
attributeName="x"
xlink:href="#redRect"
begin="0s"
dur="5s"
from="30"
to="500"
fill="freeze"
/>

fig 4
<animate
attributeName="width"
xlink:href="#redRect2"
begin="0s"
dur="1s"
from="30"
to="500"
repeatCount="indefinite"/>
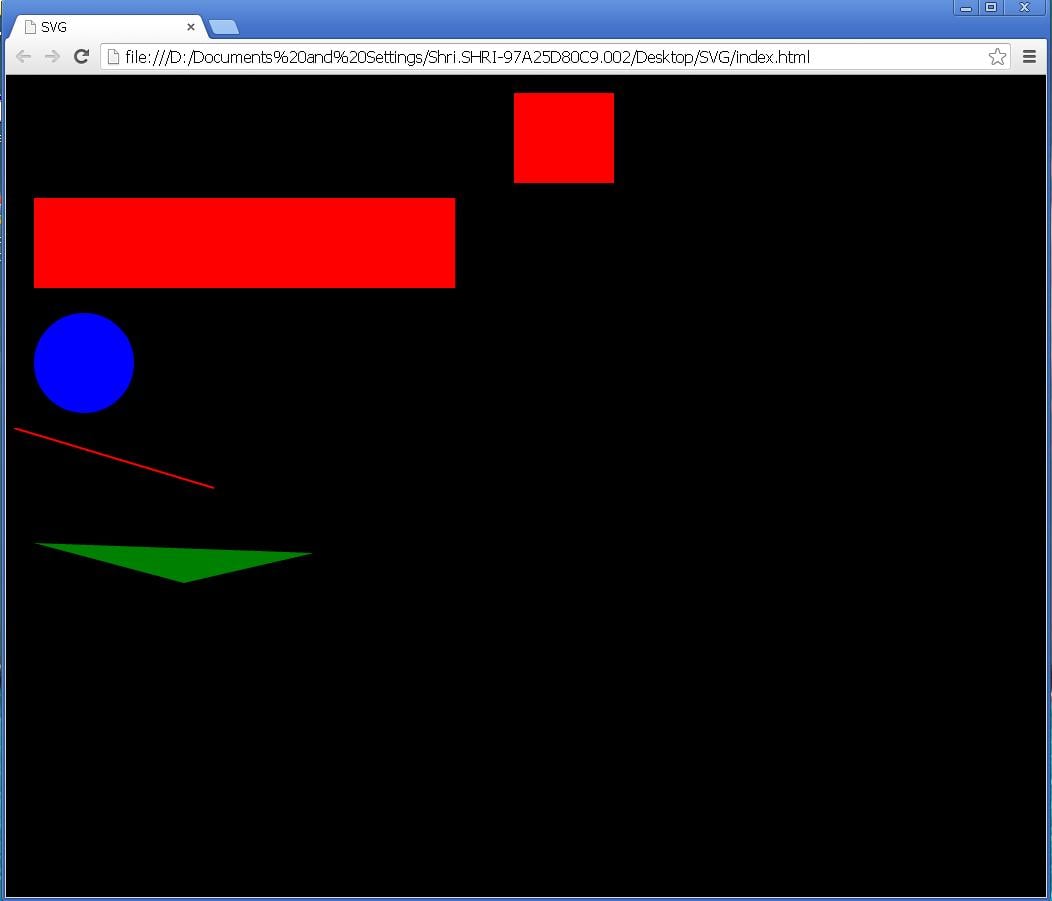
fig 5
<animate
attributeName="cx"
xlink:href="#circle1"
attributeType="XML"
begin="0s"
dur="5s"
from="30"
to="500"
fill=”freeze"/>
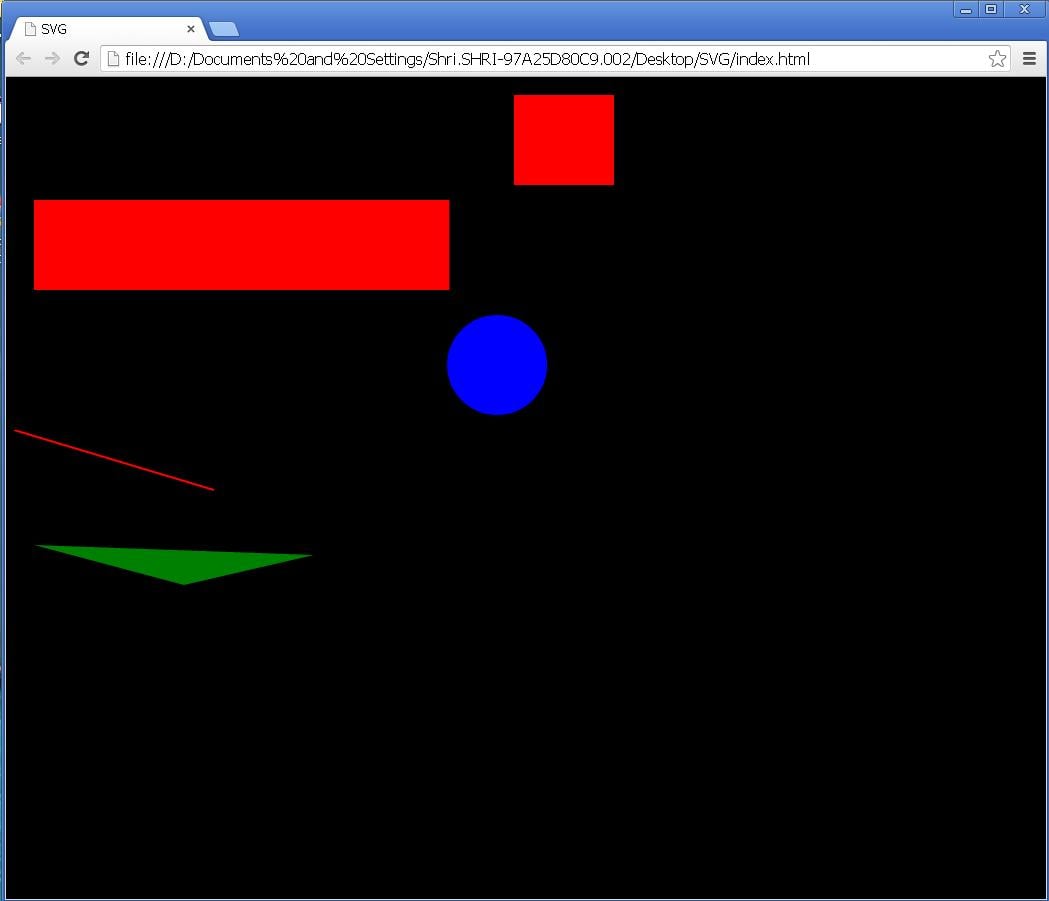
fig 6
You can see in the above figure, the circle has moved from its original position.
<animateColor
attributeName="fill"
xlink:href="#circle1"
begin="0s"
dur="5s"
values="blue;orange;yellow;green;red;indigo;violet"
repeatCount:"indefinite"/>
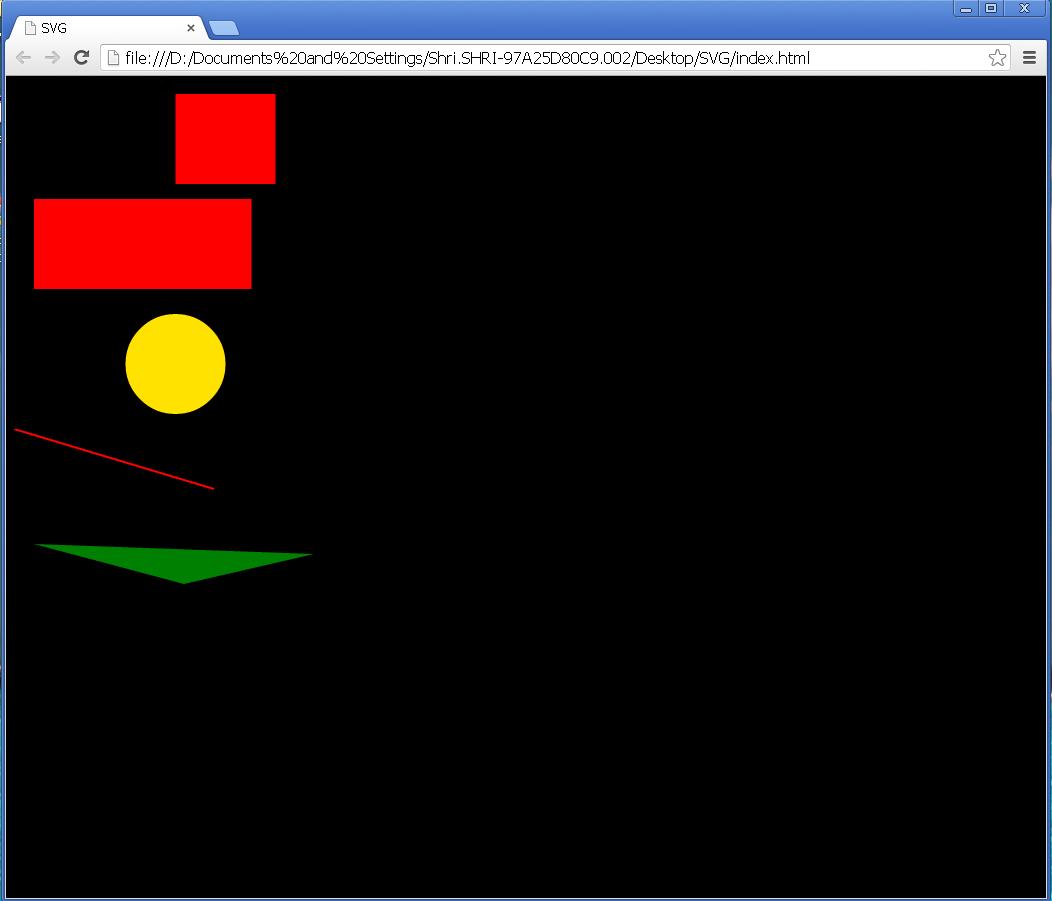
fig 7
Here, you can see that the blue coloured has changed to yellow colour. Try it and you will understand more properly.
Thus we finished practicing drawing and animating figures with SVG. Just try and enjoy it. We will be back in next session with another interesting topic.

