

Cloud computing might be one of the best ways to host the applications. However, it takes dedicated effort to manage cloud applications. Also, it is now common for companies to rely on multiple cloud computing solution. This brings us to the concept of the hybrid cloud where it is common to use private, public and other third-party services.
Hybrid clouds also force companies to manage different monitoring services, making it hard for them to have all the information under one roof. This gives rise to the need for a tool that can help manage multiple solutions at one single place. Grafana is a tool that lets you do just that. Yup, you can manage multiple cloud services through one simple dashboard.
In this article, we will go through a simple tutorial on how to monitor AWS CloudWatch With Grafana. Before we dive deep into the actual tutorial, let’s learn more about the platforms that we are using.
AWS CloudWatch: AWS CloudWatch is the Amazon’s monitoring services for cloud resources. It is used to collect and display metrics and other useful information. Administrators can use AWS CloudWatch to know what needs to be improved or get warned when something breaks. It works with all the AWS resources
Grafana: Grafana is a popular open source dashboard tool. It works out of the box with different data sources including Graphite OpenTSDB, and InfluxDB. The user can easily edit and modify the dashboard according to their requirement. It also enables them to monitor multiple solutions from a single place. It uses different types of graphs, charts and another form of tools to help users in giving them an bird eye view.
Monitor AWS CloudWatch With Grafana
Grafana comes with an easy-to-use pluggable architecture. This means that you can create a dashboard with the widgets of your liking. It also comes with plugins and widgets.
Monitoring AWS CloudWatch from Grafana is easy. All you need to do is follow the tutorial. So, without any delay, let’s get started.
IAM Role Set up
As we already know, AWS can be accessed using IAM roles. IAM roles can be an entity or a third party application.
{
    "Version": "2012-10-17",
    "Statement": [
        {
            "Sid": "1",
            "Effect": "Allow",
            "Action": [
                "cloudwatch:PutMetricData",
                "cloudwatch:GetMetricStatistics",
                "cloudwatch:GetMetricData",
                "cloudwatch:ListMetrics"
            ],
            "Resource": "*"
        }
    ]
}
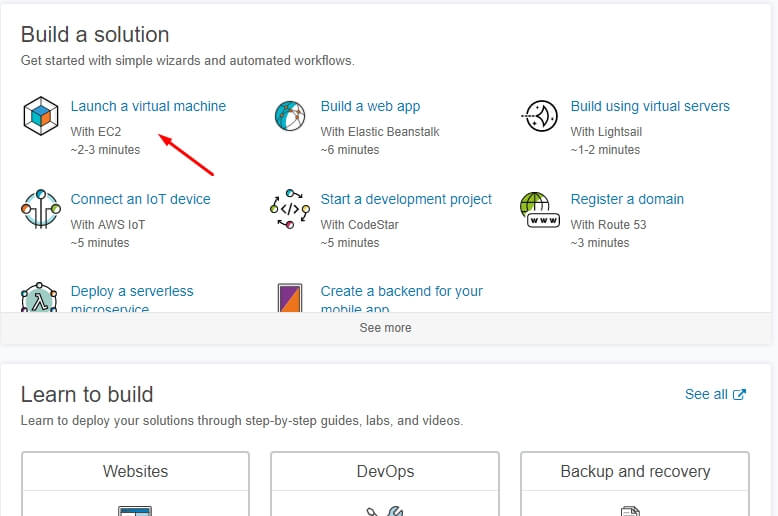
Now, that the IAM Role is created, it is now time to start an EC2 instance. You can start an EC2 instance from your AWS dashboard as shown in the image below.
You need to use the script below to launch the EC2 instance. The user-data script has all the allowances that are required to run a successful Grafana server. You need to make sure that the role that you created earlier is associated with the instance.
#!/bin/sh
yum install -y https://s3-us-west-2.amazonaws.com/grafana-releases/release/grafana-5.0.3-1.x86_64.rpm
service grafana-server start
/sbin/chkconfig --add grafana-server
Creating a Grafana Account
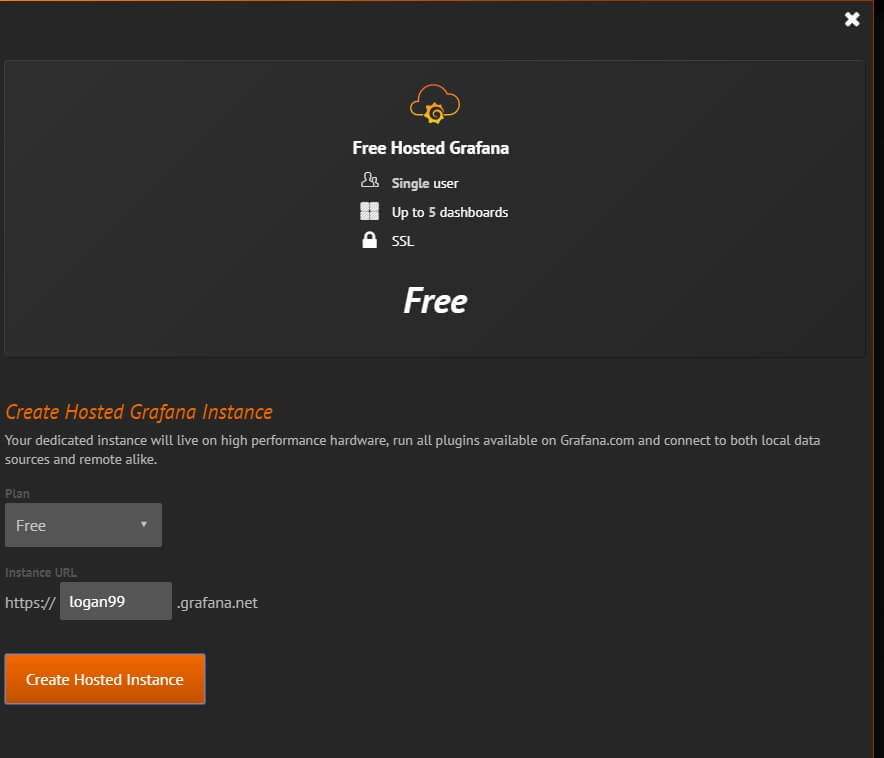
Now that you have created an IAM Role and an EC2 instance, the next step is to create your Grafana account. You can go to their official website and register a free account. As it is open source, you can either download the client or create a free instance on their website as shown in the image below.
To make your instance works as intended, you need to open port 3000 for inbound traffic. It can easily be done through Grafana Dashboard.
Connecting to your EC2 Instance using Grafana
With everything ready, it is now time to open your browser and open up the instance. To do so, type in the following in your browser.
http://instance-dns-name:3000
If you did everything correctly until now, you would be redirected to the Grafana login page as shown below.
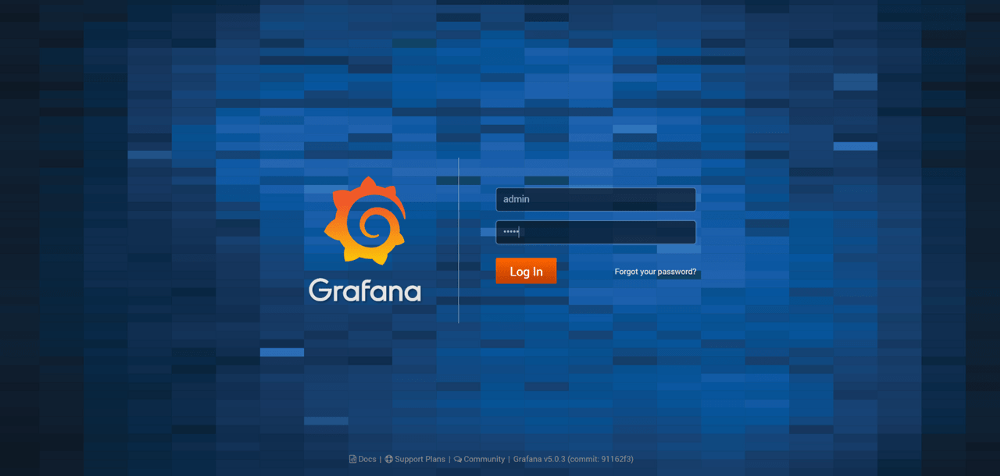
To log in, you need the username as “admin” and password as “admin.”
Once you log in, you will be greeted by the beautiful interface of Grafana. You can access the different options from the side menu as shown in the image below.
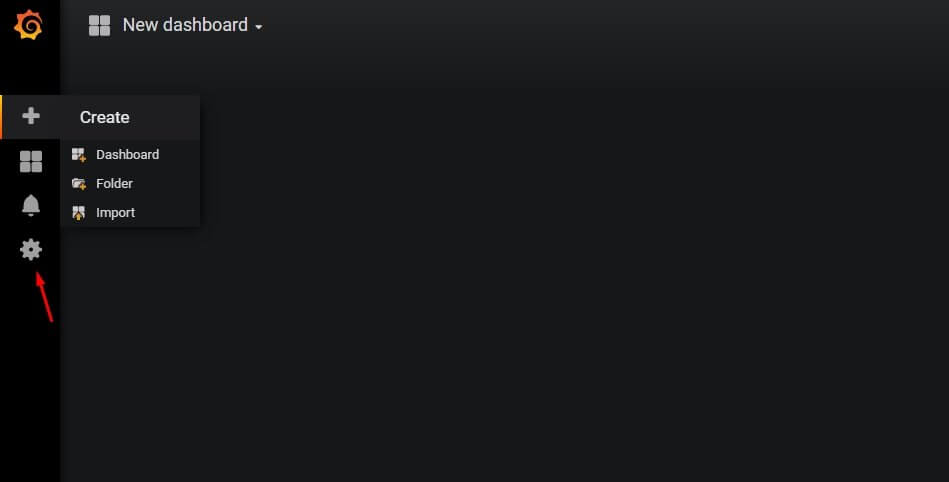
As Gafana comes with in-built support for CloudWatch, you don’t have to install any additional plugin.
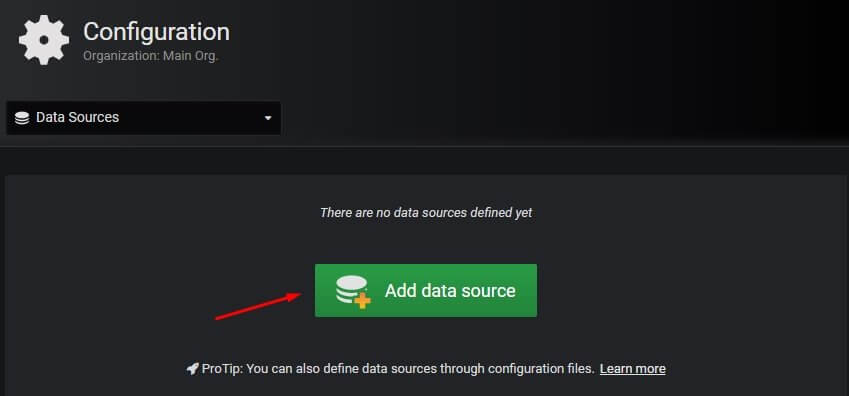
Click on the gear icon on the left menu, and then go to Data Sources. Once you are there, click on “Add Data Source.”
Now, you need to select the type to CloudWatch from the drop-down menu.
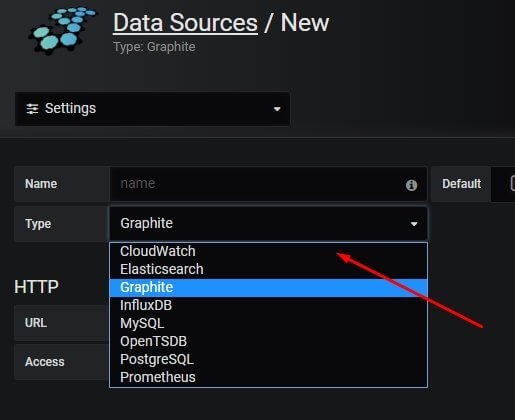
It will bring you to new form that needs to be filled.
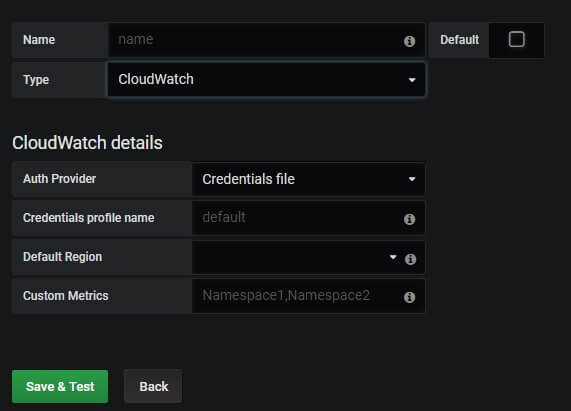
Type in the name and also select the default region. Once done, click on save and test. If it is working, it will show a message, “data source is working.”
Congratulations, you have successfully connected your EC2 instance with CloudWatch with Grafana.
Alternative approach: As we have used IAM role, we don’t have to fill up the credentials profile name. However, you can also go forward and connect without IAM role by creating a simple credentials file that will contain the AWS Secret and Access Key. The file needs to be created under ~ /.aws/credentials.
Creating a new Dashboard
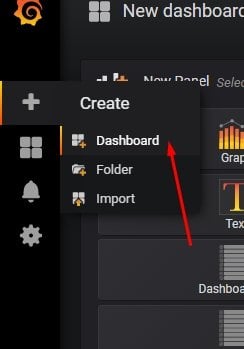
With the data source connected, it is now time to create a dashboard. To do so, just click on the “create dashboard” option from the side menu.
Add a new graph from the options available and now select AWS/EC2 as the required namespace. The other two things that you need to set is CPU Utilization as metric and also the instance id. That’s it! You have successfully created a graph and started monitoring your EC2 instance variables. You can create more graphs and widgets on dashboard according to your own requirements.
Conclusion: –
Working with Grafana will surely give you an edge as you can monitor multiple instances, both private and public. The CloudWatch API’s are used to communicate between AWS and Grafana. The good news is that Grafana comes with in-built support for AWS CloudWatch and it won’t take much of your time to set it up.
So, what do you think about the tutorial? Are you all ready to build dynamic and interactive dashboards? Comment below and let us know.

