

Octave is termed as an “open-source numerical tool which is used for programming numerical computations”. It is available under the GNU (Public License). This tool is an alternative tool for MATLAB. The acronym of MATLAB is “Matrix Laboratory”, which is widely used tool for numerical computations and implementation of artificial neural networks. A single license of MATLAB software is extremely expensive due to which developers opt for Octave.
Octave can also be used as an alternative for scripting languages like Perl, Python or PHP for computation of statistical, mathematical and graphical functions.
Features of Octave: –
- The interest of Octave was developed by programmers, research analysts, companies and research organizations who are engaged in numerical and mathematical programming.
- Octave is an open source software which means it is free to use by developers across all streams. This tool is not associated with public domain. It is under copyright and includes various terms and conditions along with defined restrictions.
MATLAB Features:
MATLAB is known for following features:
- It is an interactive tool for calculation of various algorithms including matrix algebra and matrix manipulation functions.
- It was originally designed only for numerical calculations of real numbers.
- The tool is the core of C programming language.
- This tool provides extended support for multi-dimensional arrays and various data structures and algorithms which are used in research.
- MATLAB provides complete support for implementation of artificial neural networks with proper illustration.
Now, lets take a look at the Octave tool and its analysis.
Look and feel of Octave:
The link for downloading Octave is as follows:
https://www.gnu.org/software/octave/
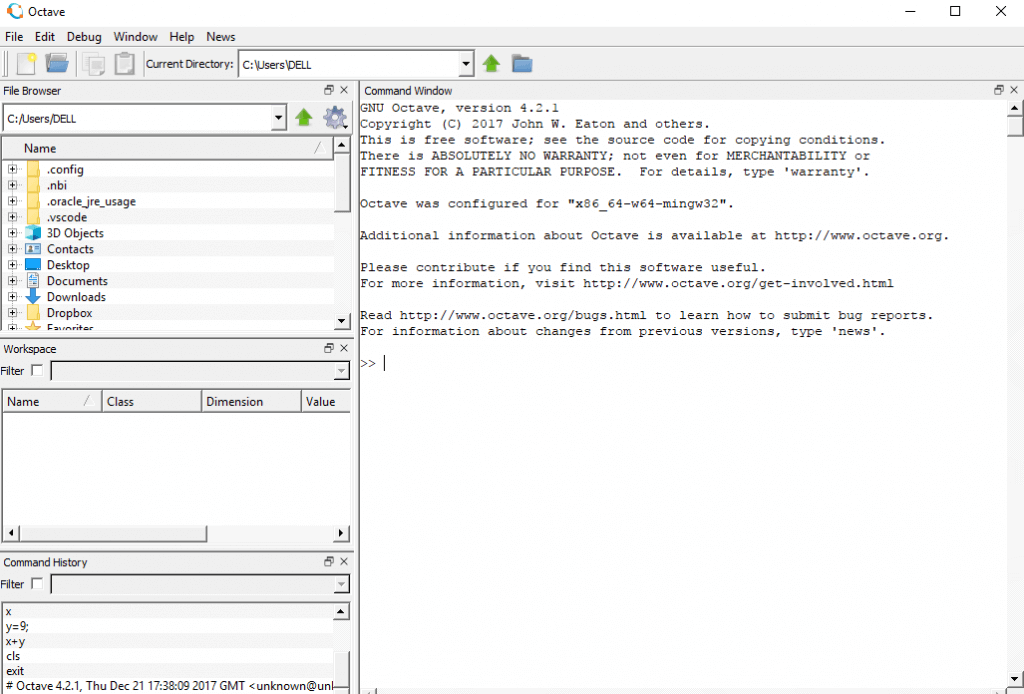
The above snapshot is the complete look and feel of Octave tool for numerical computation.
Octave provides you with:
- A large set of build-in functionalities to solve many different problems.
- A complete programming language is compatible for showing up the illustrations of artificial neural networks.
- It includes plotting facilities.
Illustrations of Octave framework:
Example 1: Declaring Vector in Octave
octave-3.2.4.exe:10> x = [0 1 2]
x =
1 2 3
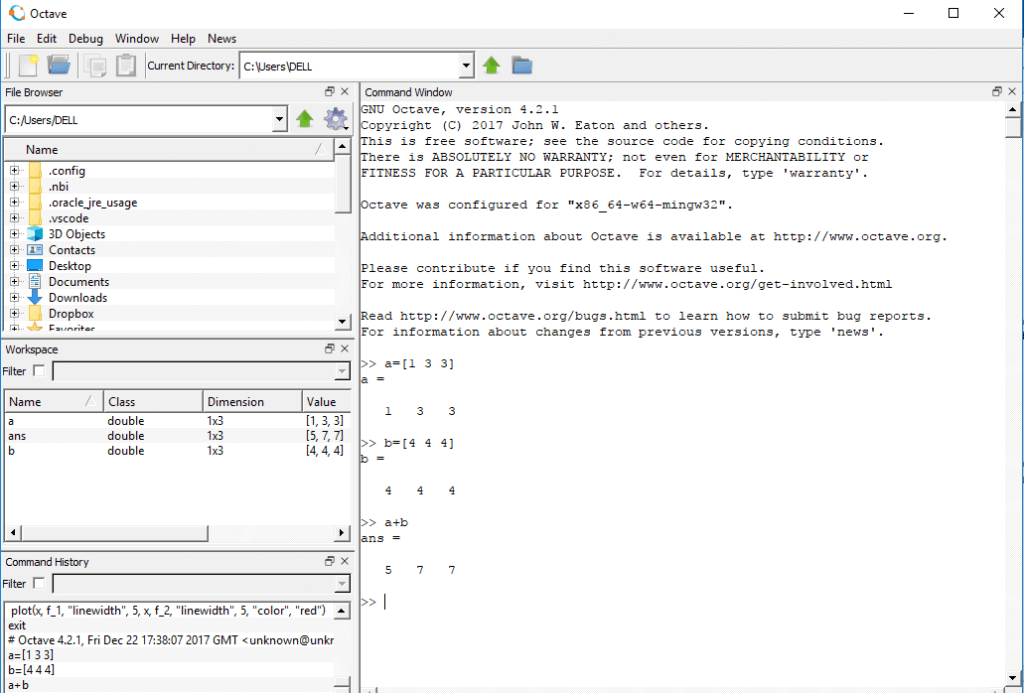
Example 2: Adding two vectors in Octave
octave-3.2.4.exe:10> a = [1 3 3]
 a = 1  3  3
octave-3.2.4.exe:11> b = [4 4 4]
 b = 4  4  4
octave-3.2.4.exe:12> a + b
 ans = 5  7  7
The output will be shown as mentioned in the snapshot below:
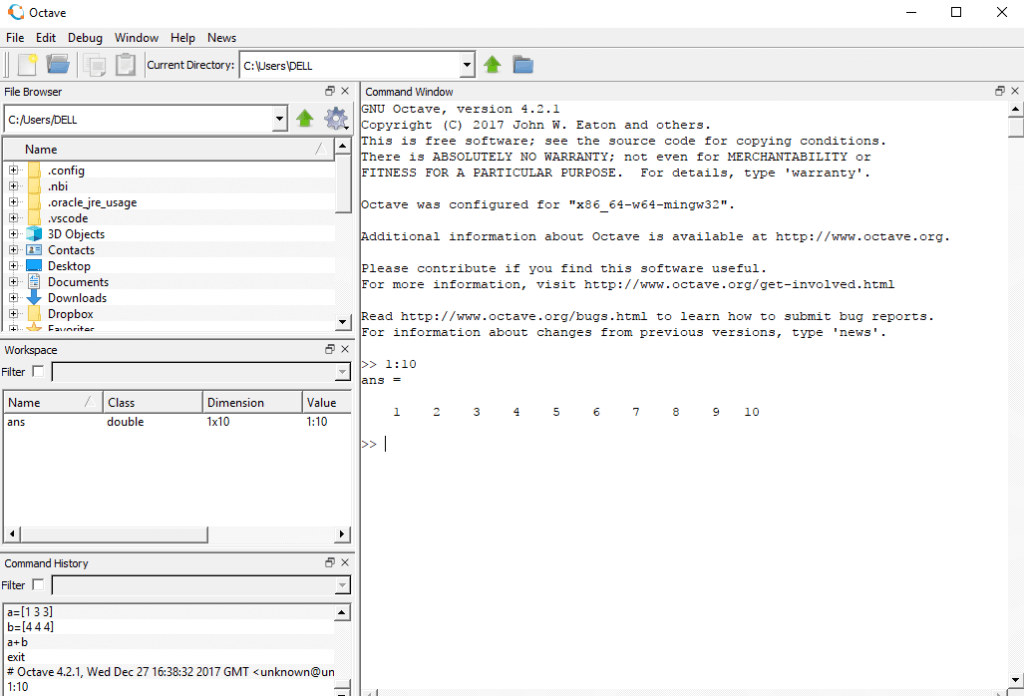
Example 3: Numeral Range in Octave
octave-3.2.4.exe:13> 1:10
 ans = 1 2 3 4 5 6 7 8 9 10
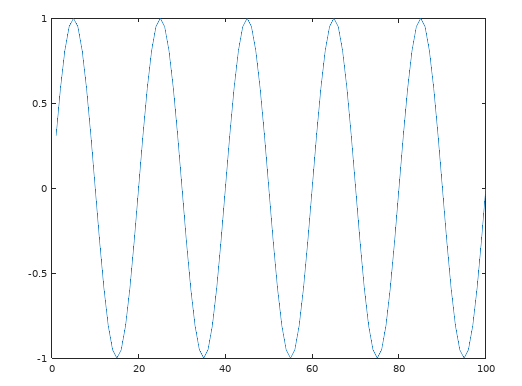
Example 4: After numerical illustrations, the basic example of plotting Graph is as follows:
octave-3.2.4.exe:15> a = 1:100;
octave-3.2.4.exe:16> pi
ans = 3.1416
octave-3.2.4.exe:17> data = sin(2*pi*a/20);
octave-3.2.4.exe:18> plot(data)
Understanding Neural Networks:
A neural network is basically a replica of a software pattern which works in similar way to the neurons in the human brain.
It is also called as artificial neural networks which forms a core of deep learning technologies. The commercial applications which are formed based on artificial neural networks focusses on problem solving methodologies. The famous examples of applications which use neural networks are data analysis, weather forecast and prediction and eye and facial recognition.
Features: –
- The architecture of neural network is designed in such a way that it includes a number of processors linked with each other operating in parallel and are arranged in tiers.
- Each tier of neural network accepts input as a normal computation from the previous tier.
- The pattern of accepting input is similar to optical nerves.
- The last tier computes all the signals as per the algorithm and produces the output.
Let’s demonstrate the implementation of artificial neural networks with the help of Octave. In this example we will focus on creating a graph as per the values fetched by the metrological department in weather forecasting.
Step 1: – A simple graph can be plotted using the following command:
octave-3.2.4.exe:13> subplot(1,1,1)
The output is achieved as follows:
Step 2: The co-ordinates are plotted using the output or the values to be traced.
octave-3.2.4.exe:13> x = [-5.5:0.1:2];
octave-3.2.4.exe:13> c_1 = [2 10.1 0 6];
octave-3.2.4.exe:13> c_2 = [2 10.1 -10.1 6];
These three variables are used for plotting graph to show the complete trend of weather forecast.
Step 3: We then calculate the ranges of f1 and f2
octave-3.2.4.exe:13> f_1 = polyval(c_1, x); f_2=polyval(c_2, x);
Step 4: The graphs are plotted with the help of these ranges.
The output is fetched as follows:
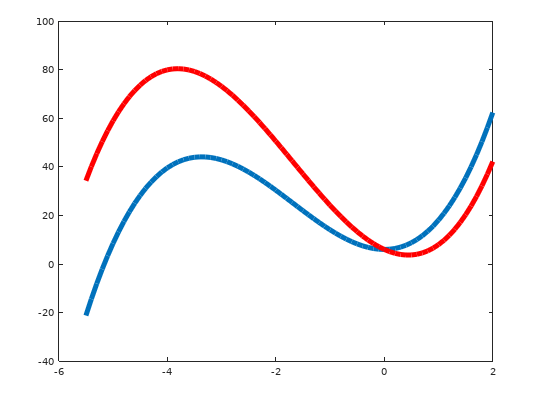
The trend chart helps to show the variation of weather forecast for an area or city.
Conclusion:
- Octave can be considered as an excellent alternative to MATLAB or excellent complement to MATLAB.
- Developers usually tend to get licensed copy of MATLAB to make sure their scripts are accurat, but Octave is used to save costs to ensure their scripts can be run by anyone, anywhere at no cost using the open source Octave tool.
- Octave helps save the considerable cost of MATLAB.
- Octave includes script which can be demonstrated in other operating systems.


Excellent post.Ne’er knew this, regards for letting me know.
I have been writing a lot of code from scratch. So Octave is my preferred choice. For users in grunt work Python and R may also be interesting. Both have massive community support and many ready libraries. But Octave is easier and faster to learn and in particular to implement.