

Data science includes modules like data analysis, manipulation, visualization and statistical modules such as probability and hypothesis. It is important to select the appropriate tool for data science. Selecting the appropriate tool depends on the use-cases, requirements, and cost of learning. When it comes to selecting the best data science tools, R and python are considered as the most appropriate programming language. R and python both include pros and cons. Let’s analyze both the tools to understand which one is right for you.
|
Python |
R |
|
| Description | King of data science programming languages | Golden child of Data Science |
| Purpose | It is a general-purpose language which is known for its simple syntax and compatibility with different operating systems. | It is an open source programming language and very beneficial for statistical computing. It operates smoothly on Linux, Windows, and Mac. |
| Features |
|
|
| Libraries |
|
|
| Popular Applications |
|
|
Strategies to select the right tool:
There are certain strategies which help data scientists, statisticians and professionals use to select the appropriate tool:
- If the project requires working with data from scratch like converting the unorganized data in a systematic manner, use python for data analysis and manipulation.
- If the data gathered after requirement analysis is clean and maintained in a systematic manner (like records in excel file), R programming is used for data analysis and manipulation
- The current trends in increasing data scientist jobs help in making a better decision with regards to the language that you should learn first, R language or Python language.
Why use Python language for Data Science programming?
- Broadness:
Python includes various add-ons and libraries for data analysis which is the core module of data science. Python programming is used broadly for web development, automation testing, and ETL - Efficient:
With the increasing amount of data that needs to be processed, it becomes primarily important for developers to manage the data efficiently. Python includes generators in the form of functions and modules to help iterative processing to work with large amounts of data sets. - Easy to understand:
Python has gained wide popularity as the syntax is crystal clear to understand. Data scientists gain expert knowledge and master programming with Python to get the output as desired with a defined number of steps.
Limitations:
- Python is slower in comparison with other programming languages as it is an interpreted language.
- Python requires rigorous testing as the errors show up in runtime.
- Python programming is still considered weak on mobile computing platforms as there are few apps created with Python as a core language.
Why use R language for data science programming?
- Best Tool:
R language is considered as the best tool for data visualization. It virtually includes all the statistical models to create unique models for visualization and data manipulation. - Research:
R programming produces best results of visualization which can be used in research papers (white papers). The results can be traced when needed and can be reproduced to create a different result structure. - Community Support:
R language provides a large community support with 1000 developers and draws talents of data scientists spread across the world. The community includes packages in various domains like finance, machine learning, web technologies and pharmacy.
Limitations:
- For the users with no programming knowledge, R language will be a little difficult as it has a steep learning curve.
- Deriving proper solutions with R programming language can be considered as slow if the code is written poorly. To overcome this drawback, it is mandatory to include libraries to achieve proper output.
Explanation:
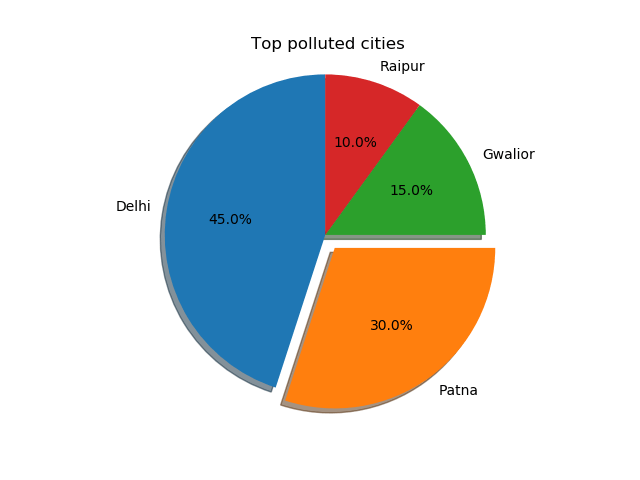
Let’s understand the workings of python and R language for data visualization module where we want to create a pie chart to depict the result.
Consider a scenario where a survey is conducted to analyze the most populated cities from a given list and there is a need to plot the topmost 4 cities in a chart.
Result:
Top polluted cities in India are:
1. Delhi
2. Patna
3. Gwalior
4. Raipur
Programming with Python:
import matplotlib.pyplot as plt

# Pie chart, where  the slices will represent the cities
labels = 'Delhi', 'Patna', 'Gwalior', 'Raipur'
sizes = [45, 30, 15, 10]
explode = (0, 0.1, 0, 0)  # only "explode" the 2nd slice (i.e. 'Hogs')

fig1, ax1 = plt.subplots()
ax1.pie(sizes, explode=explode, labels=labels, autopct='%1.1f%%',
shadow=True, startangle=90)
ax1.axis('equal')  # Equal aspect ratio ensures that pie is drawn as a circle.
plt.title("Top polluted cities")
plt.show()
Output:
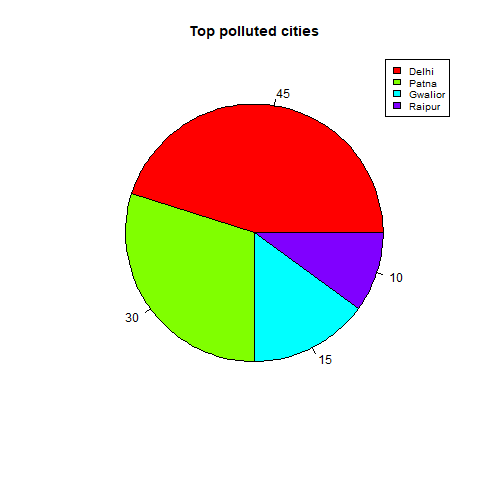
Programming with R language:
x<-  c(45, 30, 15,10)
labels<-  c("Delhi","Patna","Gwalior","Raipur")
piepercent<- round(100*x/sum(x), 1)
png(file = "city_percentage_legends.jpg")
pie(x, labels = piepercent, main = "Top polluted cities",col = rainbow(length(x))) legend("topright", c("Delhi","Patna","Gwalior","Raipur"), cex = 0.8,fill = rainbow(length(x)))
dev.off()
Output:
Conclusion: –
Selecting the appropriate language for data analysis is very important based on requirements. If the raw data is gathered, then it is always beneficial to use Python for computing data science. To use R programming language, all you need is to structure the data gathered in a systematic manner.

