

Pandas is the most widely-used open-source Python package in the field of data science and data analysis. Its name is an abbreviation for the term “Panel Data”. Pandas is fast, reliable, and easy to use. It is built on top of two important python libraries – Matplotlib and NumPy. Matplotlib is used for data visualization, and the NumPy library to perform mathematical operations on numerical arrays. Pandas make it easy to access many functions of these libraries with less amount of code.
Pandas can read various file formats like JSON, CSV, TSV, or XLSX and convert the data into a data frame (or tabular form). Further, numerous operations can be performed on the Pandas data frame for cleaning and analyzing the data. Cleaning of data, data normalization, merging rows/columns, data visualization, statistical analysis are just a few operations to name that can be performed with the Pandas package. This article will demonstrate some of the basic functionalities of the Pandas library in the Python programming language.
Installing the Pandas Package
The easiest way to install the Pandas package is from PyPi or through the Anaconda environment. For installing the package via pip, type the following command in the command prompt of your system. ![]()
The command for the same for the Anaconda environment is shown in the following figure.![]()
The complete installation guide can be found here.
Reading files in Pandas
The Pandas library can read various files in different formats like CSV, TSV, XLSX, JSON, etc.
Reading CSV File in Pandas
The following code snippet reads a dataset stored in a CSV (Comma Separated Values) file and converts it into a tabular form using the read_csv() method. 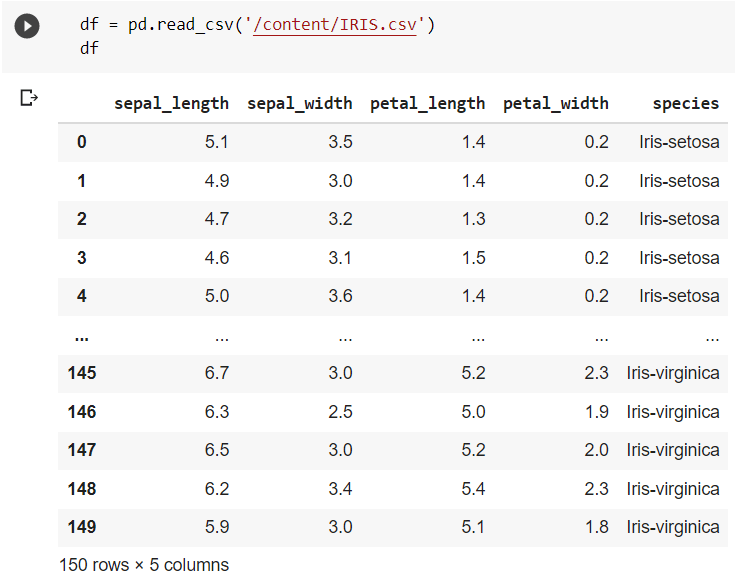 Reading JSON File in Pandas
The following code snippet reads a dataset stored in a JSON file and converts it into a tabular form using the read_json() method. 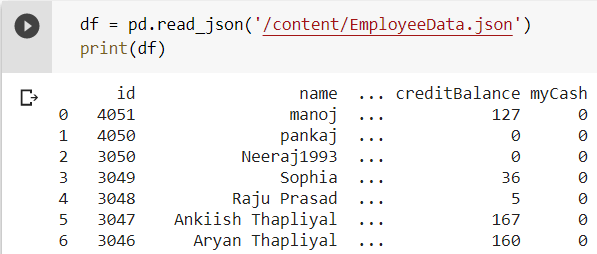 Reading an Excel File in Pandas
The following code snippet reads a dataset stored in an excel (XLSX) file and converts it into a tabular form using the read_excel() method. 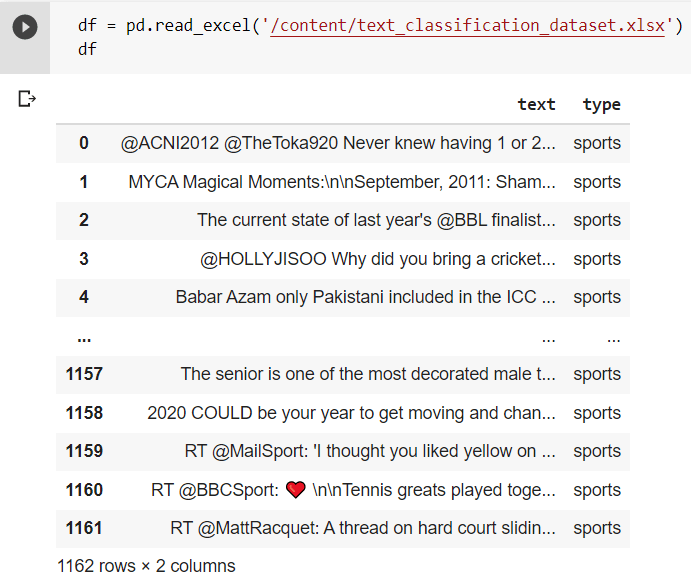 Data Frames in Pandas
A data frame is a 2-dimensional tabular data structure containing various rows and columns. Pandas offer conversion of any form of 2-dimensional data into data frames.
Creating a Data Frame From Dictionary in Python
A simple dictionary in Python can be converted into a data frame using the Pandas DataFrame() function. It generates a table containing the dictionary keys as the attributes or column names.  Locating Rows in a Data Frame
For accessing a particular row in a data frame, the loc[] command is used. It displays the entire row whose index is passed to the function. Also, a list can be passed as a parameter containing the indices which need to be accessed. 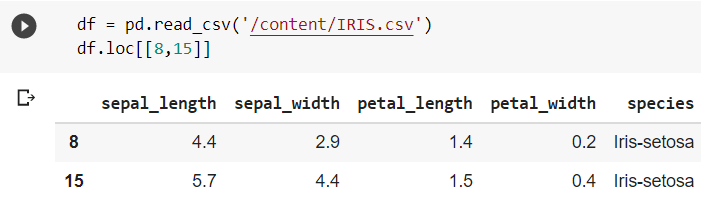 The above code snippet returns the 8th and 15th rows from the dataset.
Analyzing the Data in Pandas
Pandas provide various tools for analyzing the data to get complete information about the data. A few of them have been discussed in the following sections.
head() Method for Understanding the Data
The head() function in Pandas returns the variables with a specified number of elements of the data frame.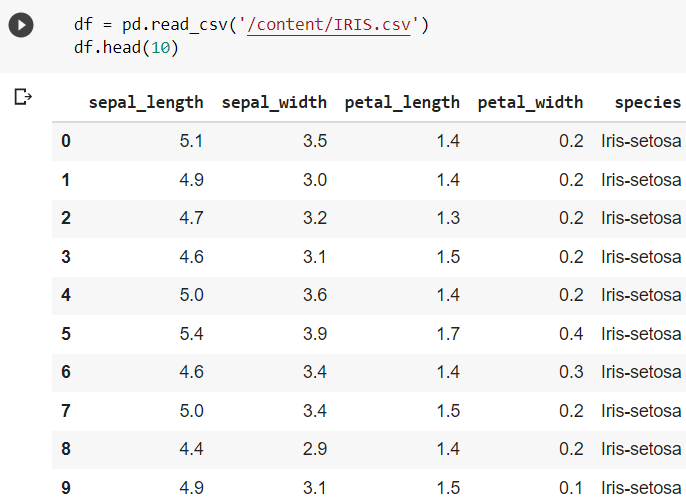
By default, it returns the first 5 elements if no arguments are passed.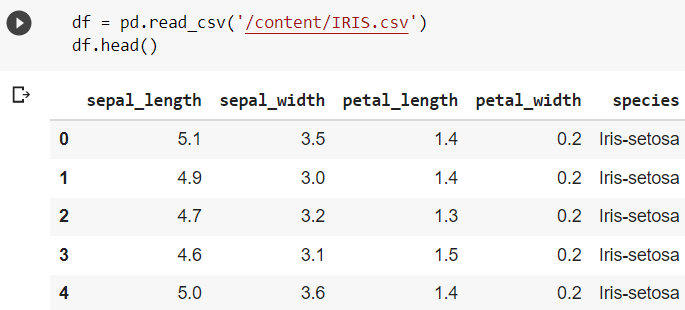 tail() Method in Pandas
The tail() function displays the specified amount of elements starting from the end of the data frame. 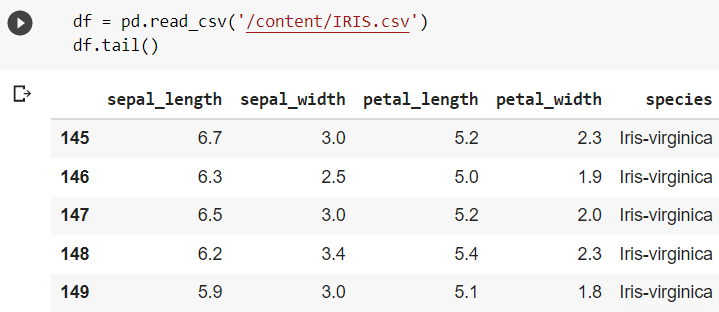 Getting Information of the dataset
The info() method in Pandas provides complete information about the dataset. It provides an insight over the datatypes, number of null or non-null elements, number of rows/columns, memory used by the data frame, etc. 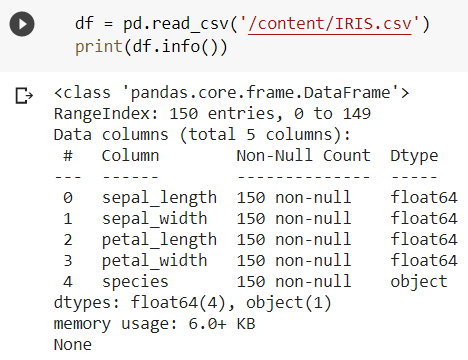 Data Cleaning Using Pandas
Pandas is also capable of cleaning a dataset. Data cleaning involves filling up the missing values, deleting duplicate elements, and resolving other inconsistencies in the data. The following sections cover a few data cleaning operations using the padas module.
Removing Empty Cells
Often, the data might contain some empty (NaN) values in some cells. These NaN values might affect the results for which the data is to be used. The cells containing NaN values must either be dropped or filled with appropriate values. The dropping of empty records is shown in the following code snippet. For demonstration, the entry for the 3rd row of the column “sepal_length” is deleted. 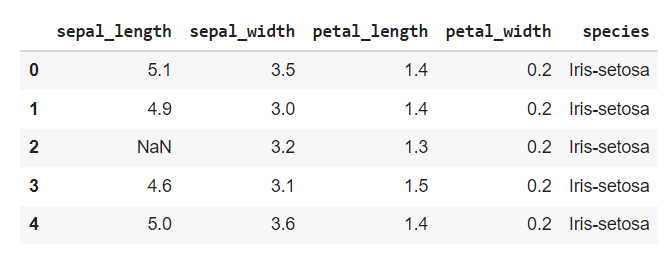
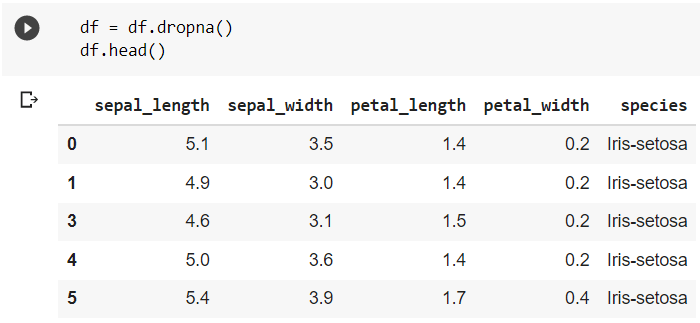 The dropna() function drops the entire row containing a null value.
Removing Duplicate Records From a Dataset
Sometimes a dataset may contain multiple records having the same elements. This unnecessarily increases the size of the data and computational load on algorithms using the data. Hence, it is advisable to remove duplicate data.
As observed in the following snippet, the first and the second rows are the same. 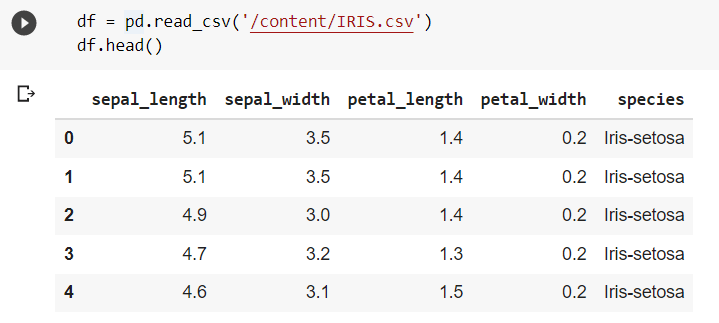 The drop_duplicates() method drops multiple records containing same elements and retains only one of them.
  Finding Correlation Between the Attributes in a Dataset
One of the most useful features of the Pandas Library is the corr() function that finds the correlation between the attributes of a data frame. Correlation represents the relationship between the variables and helps in understanding how the variables depend on each other. 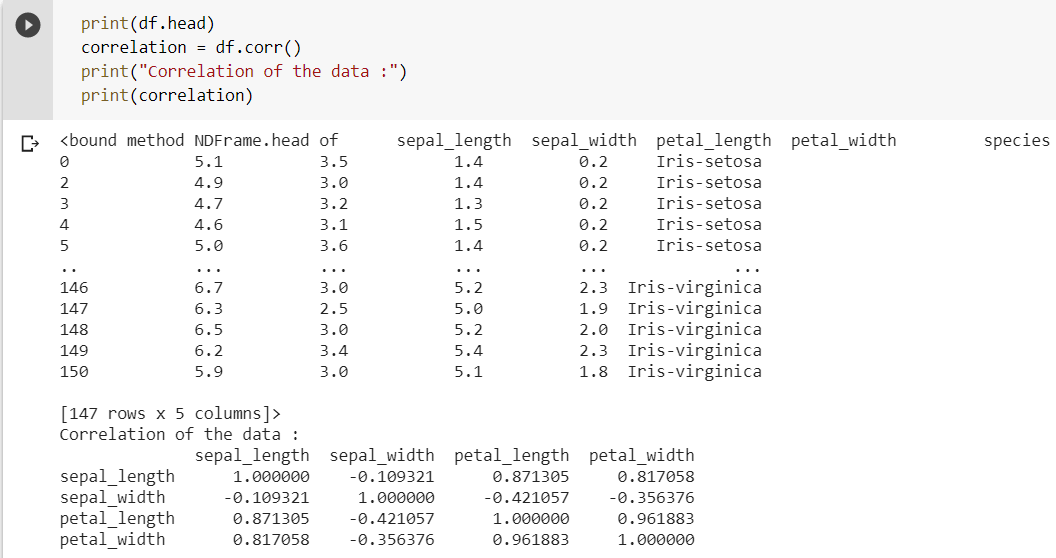 A correlation score of 1 represents perfect correlation, and 0 denotes no correlation at all. In the above snippet, it can be observed that the petal width and petal length are correlated with a score of about 0.961 that indicates that petal length and petal width are proportional to each other. Similarly, a good correlation is observed among a few other variables also.
Data Visualization in Pandas
Pandas also offer numerous data visualization tools that help in graphically plotting and understanding the nature of the data conveniently. Bar graphs, histograms, and scatter plots are a few of them to name.
Plotting Data Using the plot() Method
The plot() method plots all the variables present in the dataset. It helps in summarising the data without the need to go through all the numerical data. 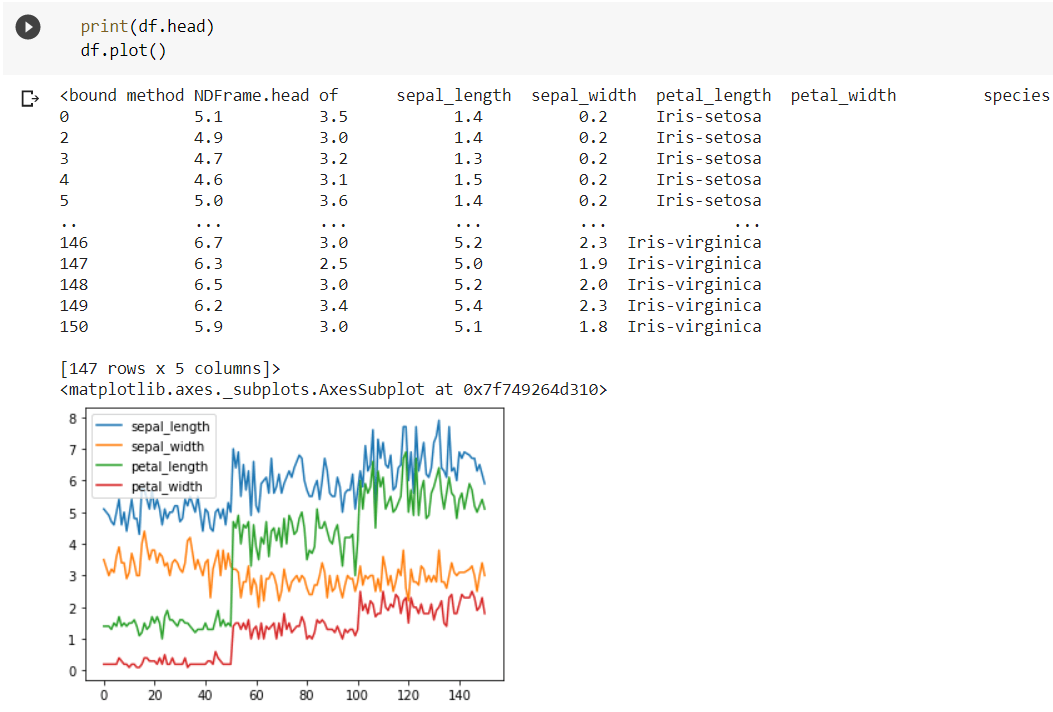 But the plot() function only generates the plot and does not displays it on the output window. For displaying the plot, we need to use the matplotlib library.
 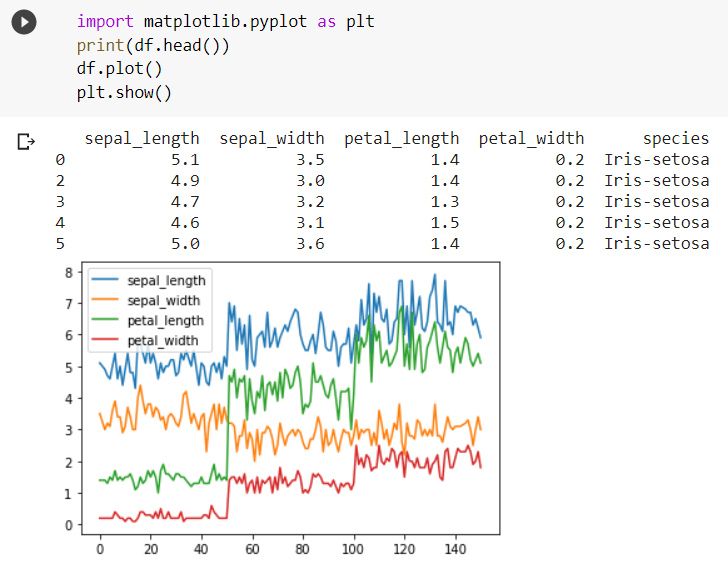 Scatter Plot in Pandas
For plotting the data on a scatter plot, we just need to pass the argument (kind = ‘scatter’) in the plot() function. 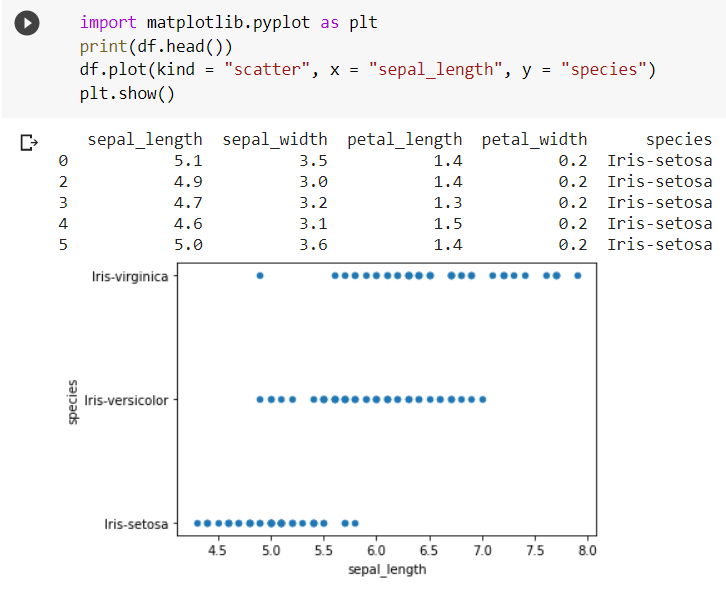 Histogram in Pandas
The plot() function can also be used to plot the histogram plots of the variables.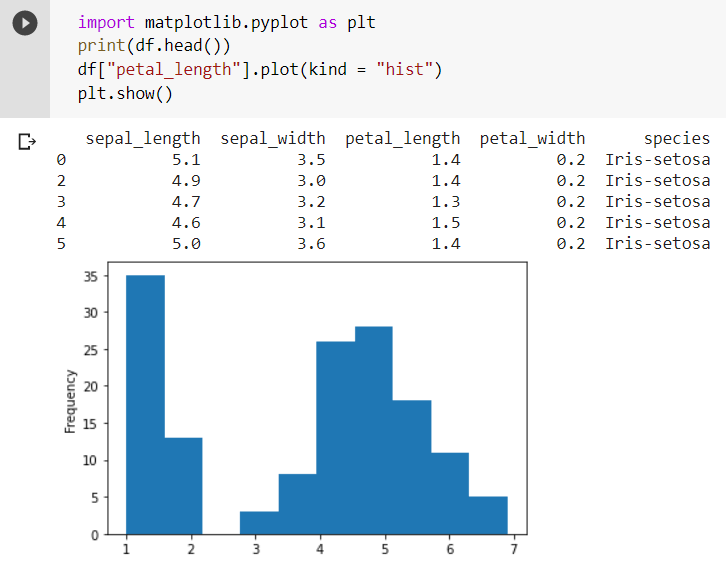 Conclusion
Due to its numerous functionalities and easy-to-use built-in functions, the Pandas library is one of the most popular libraries among data science enthusiasts and data analysts. It can read files present in many different formats and convert them into easy-to-access data frames. It can also perform various visualization operations on the data for understanding the data in better ways. The Pandas library makes the tedious job of data analysis very convenient and exciting.
Also Read: Dark Secrets of Data Science Which You Should Know

