

In this article, we are going to explore the production support capabilities of MongoDB. When your client application is built on MongoDB database or any other database, it is the responsibility of the production support team to perform necessary system health checks and operation capabilities of the database system from time to time. As a result, such databases are equipped with the important commands, which can be executed on a regular or periodic basis in order to determine the health of your database or system when needed. When you prepare a MongoDB deployment build, we could get a clear picture to understand how your application is going to perform in production with a real work load. Therefore, it is advisable to develop a consistent, repeatable approach in order to manage your production deployment environment for monitoring necessary health checks.
The following are the approaches to conduct the necessary performance tests in test environment before prompting any build in to the production environment.
- Conducting load testing: Load testing is conducted to check the operational capability of the application under load conditions i.e. when MongoDB is receiving the read and write calls as it is going to receive in production. Load is gradually increased until the application break, such a point is marked as a threshold or break point. This decides the volume of queries handled by MongoDB before breakdown.
- Stress Testing: Stress testing is the testing conducted followed by the load testing when the volume of queries to the MongoDB has exceeded the threshold in order to understand the application behavior. E.g., when there is a potential spike in volume, could MongoDB handle that load to perform necessary write-lock fire while serving queries result to the client application.
- Monitoring key metrics: Threshold, breakpoint, benchmark, throughput, CPU usage, etc. These are various kind of monitoring metrics, which are often used during performance testing in order to monitor the system health of any application, database, etc. These metrics provide the peace of mind to the project team that the application build, which will be promoted in the production, will perform as expected and cater to the organization’s business needs.
- Using that information to scale your set up: Scaling includes executing capabilities such as MongoDB is going to execute these many queries per unit time. Based on the result of the performance testing and key metrics, the performance testers evaluate the need to do necessary scaling in order to improve or bring up the overall performance of the application as required. E.g., if we wish to increase the throughput, then we can upgrade the machine or server with more powerful CPU, increase RAM (Random Access Memory), etc. on which MongoDB is installed.
MongoDB Performance Check files
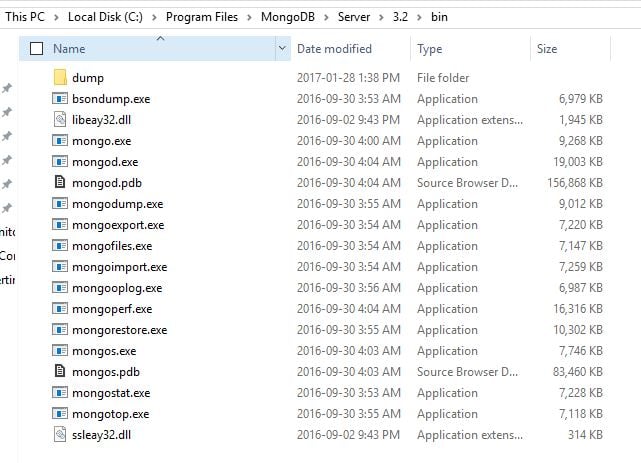
MongoDB is installed at a particular path on your local machine, or server. You need to navigate to the bin directory (here C:\Program Files\MongoDB\Server\3.2\bin) of the MongoDB installation path, you will find the executable files (such as Mongostat.exe, Mongotop.exe, etc.) which provide the necessary status and operational health related information for your MongoDB while operating in the production or UAT (User Acceptance Test) environment.
The following image shows the available executable files in the bin directory at the MongoDB installation path.
In this article, we are going to discuss about two important commands which are used to monitor your production or UAT deployment as follows.
1. Mongostat Command (Mongostat.exe)
This is a very important monitoring command to monitor the status of the MongoDB build. It serves the following purposes.
- It checks the status of all running mongodb instances and returns the counters (i.e. number of DB queries served) of database operations.
- These counters include the following types of DB Queries. They are inserts, queries, updates, deletes, and cursors.
- The command also displays the case when you are hitting page faults, and showcase your lock percentage. This is the indicator that you are running low on memory, and the hitting write capacity is not sound, or other associated performance issue.
Steps to execute Mongostat Command
- First, start your mongodb instance on your local machine or server.
- Open another command prompt and navigate to the bin directory (here C:\Program Files\MongoDB\Server\3.2\bin) of your mongodb installation.
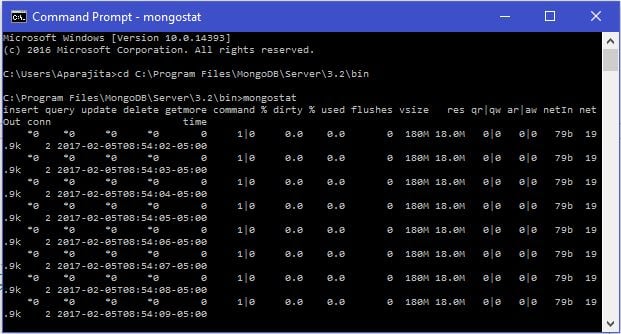
- Now type ‘mongostat’ and press enter.
Microsoft Windows [Version 10.0.14393]
(c) 2016 Microsoft Corporation. All rights reserved.

C:\Users\Aparajita>cd C:\Program Files\MongoDB\Server\3.2\bin

C:\Program Files\MongoDB\Server\3.2\bin>mongostat
Output
The following will be the output when we execute the ‘mongostat’ command.
2. Mongotop Command (mongotop.exe)
This is another important monitoring command to monitor the status of the MongoDB build. It serves the following purposes.
- It is used to track and report the read and write activities of the MongoDB instance on a collection basis. By default, the ‘mongotop’ command returns information every second, which could be changed as per need. To change the frequency of information return of the ‘mongotop’ command, we need to specify a specific number after the ‘mongotop’ command (say mongotop 30). This will return the information after every 30 seconds.
- This command helps decide and check that the read and write activities on the MongoDB are matching the application operational requirements, and such application is not firing too many write operations to the database at a time or reading the database too frequently from a disk in order to ensure that the application is not exceeding the required working set size.
Steps to execute Mongostat Command
- First, start your mongodb instance on your local machine or server.
- Open another command prompt and navigate to the bin directory (here C:\Program Files\MongoDB\Server\3.2\bin) of your mongodb installation.
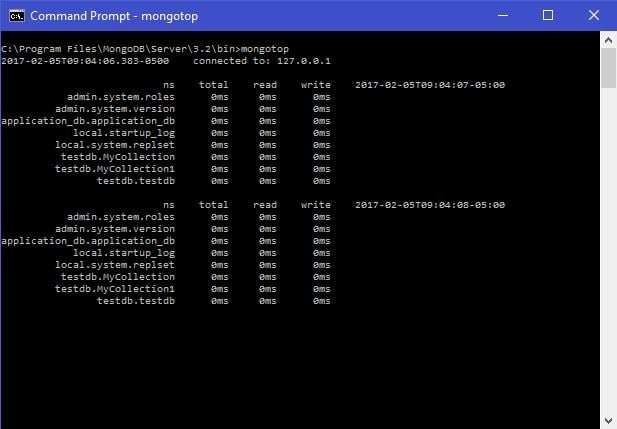
- Now type ‘mongotop’ and press enter.
Microsoft Windows [Version 10.0.14393]
(c) 2016 Microsoft Corporation. All rights reserved.

C:\Users\Aparajita>cd C:\Program Files\MongoDB\Server\3.2\bin

C:\Program Files\MongoDB\Server\3.2\bin>mongotop
Output
The following will be the output when we execute the ‘mongotop’ command.
These were inbuilt commands as a part of the MongoDB tools. There are other tools such as 10gen tool, MongoDB Management Service (MMS), etc. which can provide a dashboard to monitor the metrics from the entire MongoDB cluster.
Conclusion
In this article, we discussed the approach to monitor the production deployment’s health and operational capacity through inbuilt monitoring commands of the MongoDB database.


Great and really helpful article! Adding to the conversation, providing more information, or expressing a new point of view…Nice information and updates. Really i like it and everyday am visiting your site..
I am good follower of your site. Daily i will refer your site for enhance my knowledge in the area of world related concepts.Great jobs done by you.thanks for sharing these valuable information.