A practical, code-first guide to finding and fixing slow PostgreSQL queries — with real SQL, EXPLAIN ANALYZE output, and an easy-to-follow diagram.
A client once messaged me at midnight: “our dashboard just times out.” The database had grown from 50,000 rows to 40 million in eight months, and nobody had touched a single index. One query — a simple customer lookup — was taking 14 seconds.
That is the moment most developers start googling for PostgreSQL performance tips. The good news is that PostgreSQL is one of the most tunable databases available, and most slow queries are fixed with a handful of well-understood changes, not a rewrite of your whole schema.
This guide walks through 10 PostgreSQL performance tips you can apply today, each with runnable SQL, so you can go from a slow query to a fast one in the same afternoon. You’ll also see a simple diagram of how PostgreSQL decides between a sequential scan and an index scan, since understanding that decision is the key to most of these performance tips.
What Actually Makes a PostgreSQL Query Slow?
Before applying any PostgreSQL performance tips, it helps to know what the database is actually doing. When you run a query, PostgreSQL’s query planner chooses an execution plan — usually either:
- Sequential Scan (Seq Scan): reads every row in the table, one by one.
- Index Scan / Index Only Scan: jumps straight to the matching rows using an index, similar to using a book’s index instead of reading every page.
Most performance problems come down to the planner choosing a sequential scan when an index scan would be far faster — usually because no useful index exists, statistics are stale, or the query is written in a way that prevents index use. The diagram below shows this decision path, and it’s the mental model behind almost every tip in this article.
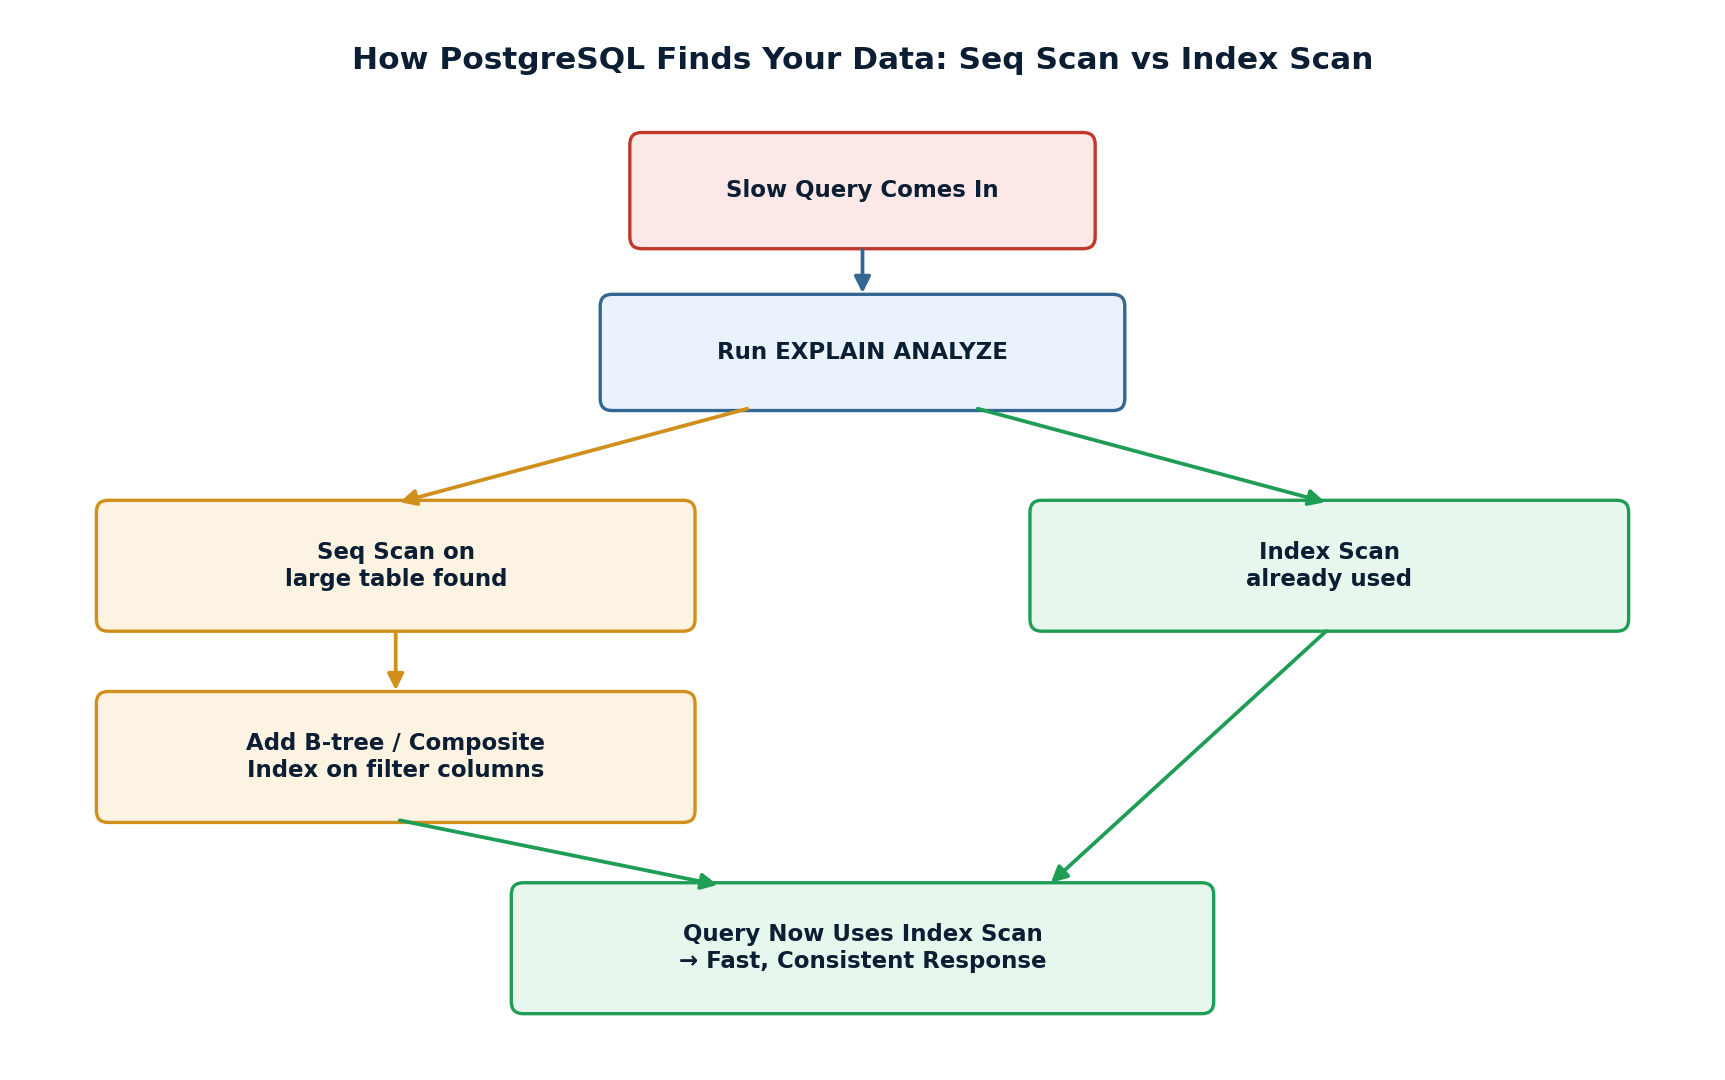
Figure 1: How PostgreSQL chooses between a sequential scan and an index scan — and how to push it toward the fast path.
10 PostgreSQL Performance Tips That Instantly Speed Up Queries
Here are the 10 PostgreSQL performance tips, in the order I’d actually apply them on a real, slow production database.
1. Always Run EXPLAIN ANALYZE Before Optimizing Anything
The single most important habit behind every list of PostgreSQL performance tips is this: never guess why a query is slow. Ask the database directly.
EXPLAIN ANALYZE
SELECT * FROM orders
WHERE customer_id = 42;
Look for two red flags in the output:
- Seq Scan on a large table — usually means a missing or unused index.
- A big gap between “estimated rows” and “actual rows” — usually means outdated statistics (fixed with ANALYZE).
EXPLAIN (ANALYZE, BUFFERS) also shows disk vs. cache reads, which is invaluable once you move on to memory tuning later in this list.
2. Add the Right Indexes — Not Just More Indexes
Indexing is the highest-leverage item on any list of PostgreSQL performance tips, but indexes aren’t free — each one speeds up reads and slows down writes. Add indexes on columns you actually filter, join, or sort by.
-- Speed up lookups by customer_id
CREATE INDEX idx_orders_customer_id
  ON orders (customer_id);

-- Confirm PostgreSQL is using it
EXPLAIN ANALYZE
SELECT * FROM orders WHERE customer_id = 42;
After adding the index, the plan should switch from Seq Scan to Index Scan (or Bitmap Index Scan for larger result sets), and execution time typically drops from seconds to milliseconds on tables with millions of rows.
3. Stop Using SELECT * in Production Queries
SELECT * forces PostgreSQL to read and transmit every column, even ones you don’t need, and it can prevent an Index Only Scan (where the index alone can answer the query without touching the table).
-- Avoid SELECT * FROM orders WHERE customer_id = 42; -- Prefer SELECT id, order_date, total_amount FROM orders WHERE customer_id = 42; |
This is a simple habit, but among PostgreSQL performance tips it’s one of the cheapest to apply — it costs nothing and pays off on every single query.
4. Use Composite and Partial Indexes for Real-World Filters
Real queries rarely filter on just one column. If you frequently filter by customer_id and status together, a single composite index serves both conditions far better than two separate indexes.
-- Composite index for a common WHERE pattern
CREATE INDEX idx_orders_customer_status
  ON orders (customer_id, status);

-- Partial index: only index the rows you actually query often
CREATE INDEX idx_orders_pending
  ON orders (customer_id)
  WHERE status = 'pending';
Partial indexes are one of the more underused PostgreSQL performance tips — they stay small and fast because they only cover the subset of rows (like pending orders) that get queried constantly.
5. Replace OFFSET Pagination with Keyset Pagination
OFFSET-based pagination gets slower page by page, because PostgreSQL still has to scan and discard every earlier row.
-- Slow on deep pages
SELECT * FROM orders
ORDER BY id
OFFSET 100000 LIMIT 20;

-- Fast at any page depth (keyset / cursor pagination)
SELECT * FROM orders
WHERE id > 100000
ORDER BY id
LIMIT 20;
Keyset pagination uses an indexed column as a cursor, so response time stays flat no matter how deep the user scrolls — a critical fix for any app with large, paginated tables.
6. Optimize JOINs with Properly Indexed Foreign Keys
Slow joins are almost always caused by an unindexed foreign key on the “many” side of the relationship.
-- Index the foreign key used in the JOIN
CREATE INDEX idx_order_items_order_id
  ON order_items (order_id);

EXPLAIN ANALYZE
SELECT o.id, oi.product_id
FROM orders o
JOIN order_items oi ON oi.order_id = o.id
WHERE o.customer_id = 42;
PostgreSQL does not automatically index foreign key columns, which surprises a lot of developers — this is one PostgreSQL performance tip that’s easy to miss until a join suddenly gets slow at scale.
7. Tune Memory Settings: work_mem, shared_buffers, effective_cache_size
Default PostgreSQL configuration is intentionally conservative so it runs on small machines. On a real server, tuning these three settings is one of the highest-impact PostgreSQL performance tips available.
-- postgresql.conf (example for a server with 16GB RAM)
shared_buffers = 4GB
effective_cache_size = 12GB
work_mem = 64MB
maintenance_work_mem = 512MB
- shared_buffers: memory PostgreSQL reserves for caching data pages (roughly 25% of RAM).
- effective_cache_size: hints the planner about how much OS-level cache is available (roughly 50-75% of RAM).
- work_mem: memory per sort/hash operation — too low causes slow disk-based sorts; too high risks memory pressure under concurrent load.
Change these gradually and re-test with EXPLAIN ANALYZE, since the right values depend heavily on your workload and hardware.
8. Keep Autovacuum and ANALYZE Running Smoothly
Tables with frequent updates and deletes accumulate “dead rows” (bloat). If autovacuum can’t keep up, both storage and query planning suffer, because the planner’s statistics go stale.
-- Check for bloat / dead tuples
SELECT relname, n_dead_tup, n_live_tup
FROM pg_stat_user_tables
ORDER BY n_dead_tup DESC
LIMIT 10;

-- Refresh planner statistics manually if needed
ANALYZE orders;
For high-write tables, consider a more aggressive autovacuum schedule rather than disabling it — disabling autovacuum is one performance “tip” you’ll see online that almost always backfires.
9. Use Connection Pooling with PgBouncer
Every PostgreSQL connection uses its own backend process and a meaningful chunk of memory. Applications that open too many short-lived connections slow the whole database down before a single query even runs.
# pgbouncer.ini (transaction pooling example)
[databases]
mydb = host=127.0.0.1 port=5432 dbname=mydb

[pgbouncer]
listen_port = 6432
pool_mode = transaction
max_client_conn = 500
default_pool_size = 25
Pointing your application at PgBouncer instead of directly at PostgreSQL is one of the PostgreSQL performance tips that pays off most under real production traffic, especially for serverless or high-concurrency apps.
10. Partition Large Tables for Faster Scans
Once a table passes tens of millions of rows, even a well-indexed query can slow down simply because the index itself gets large. Partitioning splits one big table into smaller, faster-to-scan pieces, usually by date range.
CREATE TABLE orders (
  id BIGSERIAL,
  customer_id INT,
  order_date DATE NOT NULL,
  total_amount NUMERIC
) PARTITION BY RANGE (order_date);

CREATE TABLE orders_2026_q1 PARTITION OF orders
  FOR VALUES FROM ('2026-01-01') TO ('2026-04-01');

CREATE TABLE orders_2026_q2 PARTITION OF orders
  FOR VALUES FROM ('2026-04-01') TO ('2026-07-01');
Queries that filter by order_date only scan the relevant partitions (partition pruning), which keeps response times fast even as total row count keeps growing — a long-term PostgreSQL performance tip rather than a quick fix.
Common Mistakes to Avoid
- Adding an index for every column “just in case” — this slows down every INSERT and UPDATE.
- Trusting query performance in a test database with 500 rows — always test against production-scale data.
- Disabling autovacuum instead of tuning it.
- Ignoring N+1 query patterns in application code — no index fixes a loop that runs 1,000 separate queries.
- Changing five settings at once — tune one variable at a time so you know what actually helped.
Pro Tips for Long-Term PostgreSQL Performance
| Quick-reference checklist
• Run EXPLAIN ANALYZE before and after every optimization. • Index columns used in WHERE, JOIN, and ORDER BY — not every column. • Prefer keyset pagination over OFFSET on large tables. • Review pg_stat_user_tables monthly for bloat and dead tuples. • Put PgBouncer in front of high-concurrency applications. • Re-tune work_mem and shared_buffers after any hardware change. • Partition tables before they become a problem, not after. |
Frequently Asked Questions (FAQs)
What is the fastest way to find a slow PostgreSQL query?
Enable pg_stat_statements and query it to rank statements by total execution time, then run EXPLAIN ANALYZE on the worst offenders. This combination is the starting point for almost every one of the PostgreSQL performance tips in this guide.
Do more indexes always mean better performance?
No. Indexes speed up reads but slow down writes and consume storage. The goal is the right indexes for your actual query patterns, not the maximum number of indexes.
How often should I run VACUUM in PostgreSQL?
In most cases, autovacuum handles this automatically. High-write tables may need more aggressive autovacuum settings rather than manual VACUUM commands run on a schedule.
Is PgBouncer necessary for small applications?
Not always. Connection pooling becomes valuable once you have many concurrent short-lived connections, such as serverless functions or a growing number of app servers.
Can partitioning make queries slower?
Yes, if queries don’t filter on the partition key, PostgreSQL may have to scan every partition. Partitioning helps most when most queries filter by the same column you partitioned on, like date.
Read More: Mastering SQL: A Complete Guide to Essential SQL Queries
Final Thoughts
None of these PostgreSQL performance tips require rewriting your application. Most slow queries are fixed with one missing index, one bad SELECT *, or one stale statistics table.
A good order to apply these PostgreSQL performance tips on a real project:
- Run EXPLAIN ANALYZE on your slowest queries.
- Add or fix indexes based on what the planner actually shows.
- Clean up query patterns (SELECT *, OFFSET pagination, unindexed joins).
- Tune memory settings and connection pooling for your workload.
- Partition only once a table has genuinely outgrown a single index.
Start with the first tip today — run EXPLAIN ANALYZE on the query that’s bothering you most, and you’ll usually know exactly which of these 10 PostgreSQL performance tips to apply next.
About the Author